Election Defense Alliance, Election Integrity and The Warren Poll are organizing an Election Verification Polling (EVP) project as a safeguard for the November 2008 presidential election -- and we're calling on you to help.
Exit polling provides an independent check on "official results" reported by suspect computerized voting systems. Citizens applying professionally managed, scientifically designed polling methodology will conduct exit poll voter surveys in strategically selected locations, presenting brief survey forms to voters exiting their polling places on Election Day (Tuesday, November 4th) 2008.
The voters' anonymous responses reporting how they have cast their votes will be processed and analyzed in real time.
Unlike the national exit poll conducted by a private consortium of newsmedia corporations, who withhold their raw polling data and heavily "adjust" their results to match the reported election results (!), this Citizens' Exit Poll will fully disclose the data so there can be no doubt about the truth of the numbers and what they reveal about the purported truth of the official election results -- and, for that matter, the purported truth of the corporate newsmedia exit poll.
Fully transparent exit poll data is crucial in assessing the validity of the announced election outcomes. Accept no substitutes. Volunteering for EVP will be one of the most effective contributions you can make to guard against another stolen election.
Are you ready to volunteer for the Election Verification Poll?
SIGN UP HERE [1]
Further details are provided on the EVP sign-up page. To volunteer, click the sign-up link above.
To LEARN MORE ABOUT EXIT POLLS, and why they are effective in assessing the validity of official election results, click to this page: About Exit Polling [2]
Can you help us with an Exit Polling DONATION? [3]
EVEP Election Day Report, 11/6/2008 12:05:00 PM
Election Defense Alliance and partners Election Integrity.org and The Warren Poll have completed the exhaustive Election Day phase of the 2008 Election Verification Exit Poll. With 350 interviewers, we conducted exit polls in 70 precincts in 12 states, covering these precincts with extraordinary thoroughness, approaching every exiting voter in many polling places, and in many cases generating response rates of 75 percent or higher.
This is the strongest data ever collected both for detecting election fraud and determining the efficacy of exit polling as a means for determining how voters actually cast their ballots.
Two election officials in Ohio tried to prevent us from conducting our polls, but a legal effort led by EI general counsel, Bob Fitrakis prevailed, permitting us to poll every site we selected. Some election officials refused to post the official outcomes. In at least one Florida polling site, this occurred explicitly because we had conducted our poll there. That said, most election officials were helpful and fully supportive, some even offering official support in following up any indication of a corrupted count.
The margin in the presidential election was too decisive for possible fraud to affect the outcome, but this was not true in all of Tuesday's races. Suspicious patterns were also revealed within the presidential race. We are currently analyzing the data and will post findings as they unfold.
* * * * * * *
To all those who participated and donated, we extend our appreciation and my congratulations. For the first time in 8 years, Americans have actually elected a president. Together, we played a role in that monumental fact about this historic election. After a series of increasingly extreme anti-democratic elections and initiatives (e.g., HAVA and the spread of electronic voting), we may have at least mitigated the trends.
As Steve Freeman reminds us, "America’s election processing has hardly been fixed; nor will it be without our efforts. Whatever Obama's attributes as a man and a statesman, recall that his first act in Congress was to reject Stephanie Tubb's challenge to Ohio's electors; he was convinced that Bush won the 2004 Ohio election legitimately. (The Audacity of Hope, by Barack Obama, p. 7)
So please, stay involved and/or donate [4] so that others may continue this work.
We have a mountain of high quality data that needs to be coded and analyzed.**
We also hope to follow up on disparities between official numbers and survey results by hand-counting ballots and other investigative efforts. Obama may really have been America’s choice for President, but election integrity remains no less critical an issue.
This Election Day polling project was the largest citizen-run poll ever undertaken in this country (or perhaps anywhere). We have a very rich pool of data.
If it had been necessary to give a bottom line assessment on Election Night, we would have been able to do so, but as we saw early on that this would not be necessary, we decided to take a different approach in our analysis of the data. Consequently we do not have anything quantitative to report as yet.
We can, however, say that we are incredibly indebted to our donors and our volunteers who made this work possible, and that we hope to release our first definitive reporting very soon.
In parallel to the data analysis, a separate team is assessing the polling processes and is re-designing protocols and procedures for future years.
More soon.......
Click Here to download the Introduction as a pdf [5]
The following study of suspect Proposition 8 election results in Los Angeles County, CA, is drawn from data gathered in EDA's Election Verification Exit Poll [6] (EVEP) analysis of the 2008 Presidential election, which reports similarly questionable election results in several states.
Although this exit poll analysis cannot provide conclusive proof of election fraud (because such proof would require access to memory cards and computer code accorded proprietary exemption from public examination) it does provide the strongest indirect proof available that election results have almost certainly been altered by manipulation of the computerized voting systems.
Deviations between exit polls and official results far outside margins of error, cannot be explained away by demographics or polling factors. The facts established in these reports cannot responsibly be dismissed or evaded.
Election Defense Alliance calls on legislators, secretaries of state, attorneys general, the voting public, and especially candidates in upcoming elections, to read these reports and seriously confront their implications.
An EDA Investigative Report
Richard Hayes Phillips, Ph.D.
Download the PDF [8]
Appendices added
Related report: Introduction and Executive Summary [9]
_________________________________________
Abstract
Exhaustive analysis of exit polls conducted in Los Angeles County has led to the inescapable conclusion that the vote count for Proposition 8 (the ban on same-sex marriage) was corrupted. The data were drawn from questionnaires filled out by 6326 voters at ten polling places scattered across Los Angeles County, and were properly adjusted to match the gender, age, race, and party affiliation of the electorate.
For Proposition 4 (which would have required parental notification and a waiting period for minors seeking abortions), the official results differ from the adjusted exit poll data by only 0.64%. But for Proposition 8, the disparity between the official results and the adjusted exit poll data is 5.74%, enough to affect the margin by 11.48%. Because Los Angeles County comprised 24.23% of the statewide electorate, an error of that magnitude would have affected the statewide margin by 2.78%, accounting for most of the official 4.48% statewide margin of victory. There were not enough Republican voters to account for the disparity between the exit poll and the official results even if every Republican non-responder voted for Proposition 8. The Edison-Mitofsky exit poll showed a similar disparity statewide, indicating that altered vote counts may not be limited to Los Angeles County.
Click Here to download the Introduction as a pdf [10]
The following study of suspect Proposition 8 election results in Los Angeles County, CA, is drawn from data gathered in EDA's Election Verification Exit Poll [6] (EVEP) analysis of the 2008 Presidential election, which reports similarly questionable election results in several states.
Although this exit poll analysis cannot provide conclusive proof of election fraud (because such proof would require access to memory cards and computer code accorded proprietary exemption from public examination) it does provide the strongest indirect proof available that election results have almost certainly been altered by manipulation of the computerized voting systems.
Deviations between exit polls and official results far outside margins of error, cannot be explained away by demographics or polling factors. The facts established in these reports cannot responsibly be dismissed or evaded.
Election Defense Alliance calls on legislators, secretaries of state, attorneys general, the voting public, and especially candidates in upcoming elections, to read these reports and seriously confront their implications.
An EDA Investigative Report
Richard Hayes Phillips, Ph.D.
Download the PDF [8]
Appendices added
Related report: Introduction and Executive Summary [9]
_________________________________________
Abstract
Exhaustive analysis of exit polls conducted in Los Angeles County has led to the inescapable conclusion that the vote count for Proposition 8 (the ban on same-sex marriage) was corrupted. The data were drawn from questionnaires filled out by 6326 voters at ten polling places scattered across Los Angeles County, and were properly adjusted to match the gender, age, race, and party affiliation of the electorate.
For Proposition 4 (which would have required parental notification and a waiting period for minors seeking abortions), the official results differ from the adjusted exit poll data by only 0.64%. But for Proposition 8, the disparity between the official results and the adjusted exit poll data is 5.74%, enough to affect the margin by 11.48%. Because Los Angeles County comprised 24.23% of the statewide electorate, an error of that magnitude would have affected the statewide margin by 2.78%, accounting for most of the official 4.48% statewide margin of victory. There were not enough Republican voters to account for the disparity between the exit poll and the official results even if every Republican non-responder voted for Proposition 8. The Edison-Mitofsky exit poll showed a similar disparity statewide, indicating that altered vote counts may not be limited to Los Angeles County.
Click Here to download the Introduction as a pdf [11]
The following study of suspect Proposition 8 election results in Los Angeles County, CA, is drawn from data gathered in EDA's Election Verification Exit Poll [6] (EVEP) analysis of the 2008 Presidential election, which reports similarly questionable election results in several states.
Although this exit poll analysis cannot provide conclusive proof of election fraud (because such proof would require access to memory cards and computer code accorded proprietary exemption from public examination) it does provide the strongest indirect proof available that election results have almost certainly been altered by manipulation of the computerized voting systems.
Deviations between exit polls and official results far outside margins of error, cannot be explained away by demographics or polling factors. The facts established in these reports cannot responsibly be dismissed or evaded.
Election Defense Alliance calls on legislators, secretaries of state, attorneys general, the voting public, and especially candidates in upcoming elections, to read these reports and seriously confront their implications.
An EDA Investigative Report
Richard Hayes Phillips, Ph.D.
Download the PDF [8]
Appendices added
Related report: Introduction and Executive Summary [9]
_________________________________________
Abstract
Exhaustive analysis of exit polls conducted in Los Angeles County has led to the inescapable conclusion that the vote count for Proposition 8 (the ban on same-sex marriage) was corrupted. The data were drawn from questionnaires filled out by 6326 voters at ten polling places scattered across Los Angeles County, and were properly adjusted to match the gender, age, race, and party affiliation of the electorate.
For Proposition 4 (which would have required parental notification and a waiting period for minors seeking abortions), the official results differ from the adjusted exit poll data by only 0.64%. But for Proposition 8, the disparity between the official results and the adjusted exit poll data is 5.74%, enough to affect the margin by 11.48%. Because Los Angeles County comprised 24.23% of the statewide electorate, an error of that magnitude would have affected the statewide margin by 2.78%, accounting for most of the official 4.48% statewide margin of victory. There were not enough Republican voters to account for the disparity between the exit poll and the official results even if every Republican non-responder voted for Proposition 8. The Edison-Mitofsky exit poll showed a similar disparity statewide, indicating that altered vote counts may not be limited to Los Angeles County.
The Ballot Propositions
Citizen exit polls were conducted by trained volunteers on behalf of Election Defense Alliance (EDA) on November 4, 2008 at 37 sites in eight states, including ten polling places in Los Angeles County. The purpose was not only to collect demographic data (gender, age, race, and party affiliation) for election analysis, but also to reach a large enough sample of voters at the polls to verify (or question) the official results. In Los Angeles, four ballot propositions (as well as the presidential election and some local contests) were included on the questionnaire handed to voters. Two of these propositions are of limited use as analytical tools for election verification:
Proposition 1A was a bond issue for a high-speed passenger train. It passed with 52.7% of the vote, according to the official results. Support for Proposition 1A was geographically based. Among the 25 most populated counties in California (those with more than 100,000 ballots cast), Proposition 1A received more than 60% of the vote in seven counties on or near San Francisco Bay (San Francisco 78.4%, Marin 65.2%, Sonoma 63.9%, Alameda 62.8%, San Mateo 61.1%, Santa Clara 60.4%, and Santa Cruz 60.2%). Nowhere else was support for Proposition 1A that high, although it did receive 59.1% of the vote in nearby Monterey County. Its next best showing among the 25 most populated counties was 55.6% in Los Angeles County. These would be the counties with the most to gain from the passage of Proposition 1A.
Proposition 11 was a Constitutional amendment involving redistricting of legislative districts. It was defeated in 2005, but passed in 2008 with 50.9% of the vote, according to the official results. It was defeated soundly in San Francisco County, receiving only 36.9% of the vote. But in 21 of the 25 most populated counties, the vote was very close; support for Proposition 11 ranged only from 46.8% to 55.8% (the other exceptions being 59.1% in Placer County, 57.5% in Marin County, and 44.8% in Alameda County), with little or no apparent correlation with party affiliation. In no county other than San Francisco did Proposition 11 receive more than 60% or less than 40% of the vote.
The other two ballot propositions are well suited for direct comparison. Proposition 4 was a Constitutional Amendment requiring a waiting period and parental notification before termination of a minor’s pregnancy. It had been defeated twice before, in 2005 and in 2006, and was defeated for the third time in 2008, winning only 48.0% of the vote statewide, according to the official results. Proposition 8 was a Constitutional Amendment eliminating the right of same-sex couples to marry. According to the Edison-Mitofsky statewide exit poll, Proposition 8 was headed for defeat by a margin of 52% to 48%. Instead it passed statewide with 52.2% of the vote, according to the official results. Because of the unexpected passage of Proposition 8, election integrity advocates have wondered aloud if the official results were legitimate.
TABLE 1: OFFICIAL RESULTS IN THE TWENTY-FIVE MOST POPULATED COUNTIES
|
|
Yes 1A |
No 1A |
Yes 4 |
No 4 |
Yes 8 |
No 8 |
Yes 11 |
No 11 |
|
|
|
|
|
|
|
|
|
|
|
Alameda |
62.8% |
37.2% |
35.7% |
64.3% |
38.0% |
62.0% |
44.8% |
55.2% |
|
Contra Costa |
54.4% |
45.6% |
41.7% |
58.3% |
44.6% |
55.4% |
51.8% |
48.2% |
|
Fresno |
55.5% |
44.5% |
60.0% |
40.0% |
68.7% |
31.3% |
52.4% |
47.6% |
|
Kern |
50.8% |
49.2% |
65.5% |
34.5% |
75.3% |
24.7% |
47.6% |
52.4% |
|
Los Angeles |
55.6% |
44.4% |
46.2% |
53.8% |
50.0% |
50.0% |
47.6% |
52.4% |
|
Marin |
65.2% |
34.8% |
25.6% |
74.4% |
24.9% |
75.1% |
57.5% |
42.5% |
|
Monterey |
59.1% |
40.9% |
43.8% |
56.2% |
48.4% |
51.6% |
46.8% |
53.2% |
|
Orange |
43.6% |
56.4% |
54.4% |
45.6% |
57.7% |
42.3% |
55.0% |
45.0% |
|
Placer |
39.6% |
60.4% |
50.3% |
49.7% |
59.8% |
40.2% |
59.1% |
40.9% |
|
Riverside |
49.0% |
51.0% |
60.1% |
39.9% |
64.7% |
35.3% |
53.3% |
46.7% |
|
Sacramento |
47.7% |
52.3% |
46.2% |
53.8% |
53.9% |
46.1% |
55.8% |
44.2% |
|
San Bernardino |
46.2% |
53.8% |
59.2% |
40.8% |
66.8% |
33.2% |
51.7% |
48.3% |
|
San Diego |
48.5% |
51.5% |
52.8% |
47.2% |
53.8% |
46.2% |
54.4% |
45.6% |
|
San Francisco |
78.4% |
21.6% |
24.6% |
75.4% |
24.8% |
75.2% |
36.9% |
63.1% |
|
San Joaquin |
53.3% |
46.7% |
55.6% |
44.4% |
65.5% |
34.5% |
50.3% |
49.7% |
|
San Luis Obispo |
46.3% |
53.7% |
44.6% |
55.4% |
51.1% |
48.9% |
50.6% |
49.4% |
|
San Mateo |
61.1% |
38.9% |
37.4% |
62.6% |
38.2% |
61.8% |
51.0% |
49.0% |
|
Santa Barbara |
54.2% |
45.8% |
42.5% |
57.5% |
46.4% |
53.6% |
53.1% |
46.9% |
|
Santa Clara |
60.4% |
39.6% |
43.1% |
56.9% |
44.2% |
55.8% |
53.2% |
46.8% |
|
Santa Cruz |
60.2% |
39.8% |
27.8% |
72.2% |
28.7% |
71.3% |
50.3% |
49.7% |
|
Solano |
53.9% |
46.1% |
50.2% |
49.8% |
55.9% |
44.1% |
52.3% |
47.7% |
|
Sonoma |
63.9% |
36.1% |
33.2% |
66.8% |
33.5% |
66.5% |
53.0% |
47.0% |
|
Stanislaus |
49.0% |
51.0% |
59.8% |
40.2% |
67.9% |
32.1% |
52.0% |
48.0% |
|
Tulare |
44.9% |
55.1% |
65.8% |
34.2% |
75.1% |
24.9% |
49.8% |
50.2% |
|
Ventura |
48.5% |
51.5% |
49.5% |
50.5% |
52.9% |
47.1% |
51.7% |
48.3% |
|
|
|
|
|
|
|
|
|
|
|
State Totals |
52.7% |
47.3% |
48.0% |
52.0% |
52.2% |
47.8% |
50.9% |
49.1% |
NOTE: These were the twenty-five counties with 100,000 or more ballots cast. The thirteen counties with more than 250,000 ballots cast are shown in blue. The percentages do not include “undervotes” – those who did not vote on the proposition. Only the “yes” and “no” votes are included in the calculations.
Proposition 4 is clearly the most reasonable benchmark with which to compare Proposition 8, because both were hot-button social issues with overlapping support among the electorate. Exit poll data bear this out. In the ten polling places combined, 66.63% voted in favor of both propositions, or against both propositions; only 23.08% voted for one proposition and against the other (6.67% voted on one or the other, but not both; and 3.62% voted on neither proposition). (See Table 2)
TABLE 2: EXIT POLL DATA FOR ALL TEN POLLING PLACES COMBINED,
SHOWING OVERLAPPING ELECTORATE ON PROPOSITIONS 4 AND 8
|
Yes 4, Yes 8 |
1552 |
24.53% |
|
No 4, No 8 |
2663 |
42.10% |
|
Yes 4, No 8 |
791 |
12.50% |
|
No 4, Yes 8 |
669 |
10.58% |
|
Yes 4 |
59 |
0.93% |
|
Yes 8 |
58 |
0.92% |
|
No 4 |
139 |
2.20% |
|
No 8 |
166 |
2.62% |
|
no vote |
229 |
3.62% |
|
Ballots Cast |
6326 |
100% |
Statewide, as stated above, Proposition 8 received 52.2% of the vote and Proposition 4 received only 48.0% of the vote, a differential of 4.2%, according to the official results. This pattern, with Proposition 8 running ahead of Proposition 4, appeared in 24 of the 25 most populated counties, the differential ranging from 0.2% in San Francisco County to 9.9% in San Joaquin County. The only exception was Marin County, where Proposition 4, with 25.6% of the vote, ran 0.7% ahead of Proposition 8, with 24.9% of the vote.
If the official results are true and correct, one would expect those results to be closely matched by exit polls. In the ten polling places in Los Angeles County where citizen exit polls were conducted, Proposition 8 ran 3.68% ahead of Proposition 4, according to the official results. But according to the exit polls, the reverse was true – Proposition 4 ran 2.01% ahead of Proposition 8 (see Table 3), which amounts to a disparity of 5.69%. Looked at another way, both propositions ran better in the official results than in the exit polls -- Proposition 4 by 2.06%, and Proposition 8 by 7.75%, which amounts to the same differential of 5.69%. Again, these percentages do not include “undervotes.”
TABLE 3: COMPARISON OF EXIT POLL DATA AND OFFICIAL RESULTS FOR
PROPOSITIONS 4 AND 8, ALL TEN POLLING PLACES COMBINED
|
|
Official |
LA% |
Exit Poll |
EP% |
Difference |
|
|
|
+3.68% |
|
-2.01% |
5.69% |
|
Ballots Cast |
11654 |
|
6326 |
|
|
|
Yes 4 |
4686 |
43.53% |
2402 |
41.47% |
2.06% |
|
No 4 |
6078 |
56.47% |
3390 |
58.53% |
|
|
Yes 8 |
5325 |
47.21% |
2360 |
39.46% |
7.75% |
|
No 8 |
5954 |
52.79% |
3620 |
60.54% |
NOTE: In California, absentee voters can hand deliver their ballots at the polls. In this report, absentee voters are not included in the exit poll data or in the official results, so the data are directly comparable.
This disparity appears in all ten polling places, and always in the same direction. (See Table 4) Proposition 8 always fares better relative to Proposition 4 in the official results than in the exit polls; the disparities range from 2.2% at Topanga to 10.5% at Long Beach. Considered alone, Proposition 8 fares better in the official results than in the exit polls in 9 of 10 polling places, by 7.75% overall; the differentials reach 11.3% at Eagle Rock, and 17.7% at Glendale, and the disparities between the margins of victory or defeat (that is, the point spread) would be twice as much. For example, at Glendale, Proposition 8 lost by 29.0% in the exit poll, but passed by 6.4% in the official results; the disparity in the point spread is 35.4%.
When comparing exit poll data with official results, it is common practice to compare the difference in the point spread. Think of it this way. If we are dividing a bushel of apples, and I have three more than half, and you have three less than half, I have six more than you do. This method works even if there are more than two choices on the ballot, in which case the difference between the exit poll data and the official results may be greater for one candidate than another.
Proposition 4, considered alone, fares better in the official results than in the exit polls by only 2.06%, which suggests that the sample of voters responding to the exit poll was quite representative of the electorate. Moreover, Proposition 4 fares better in the official results than in the exit polls in only 5 of 10 polling places, which is exactly what one would expect from a reliable exit poll. The disparities should balance out – some in one direction, and some in the other. The very fact that this was the case in regard to one proposition but not the other suggests the official results for Proposition 8 are wrong.
There are four possible reasons for a large disparity between exit polls and official results: (1) a basic flaw in the exit poll methodology; (2) many voters lying on the questionnaire; (3) a non-representative sample of voters responding; or (4) the official results being erroneous or fraudulent. Let us consider the first three possibilities one at a time.
It is very hard to argue that some flaw in the exit poll methodology would be responsible for a glaring disparity concerning Proposition 8 and not with Proposition 4. While I shall leave it to those who conducted the exit polls to explain their methodology, I must note that the exit polls in Los Angeles County were organized by Judy Alter, who had already done this five times previously. The number of voters responding – 6326 in Los Angeles County alone – was larger than the statewide sample relied upon by Edison-Mitofsky, and amounted to 54.28% of the total ballots cast in these ten polling places.
It is difficult to believe that many voters lied on the questionnaires, as this explanation would require that voters in all ten polling places lied about how they voted on Proposition 8, but told the truth about Proposition 4. Note that in 8 of 10 polling places, the disparity between the exit poll percentages and the official results is greater for Proposition 8 than for Proposition 4.
And it seems unlikely that in ten different polling places, scattered all over Los Angeles County, in a variety of neighborhoods with many different ethnic groups, the voters responding to the exit poll comprised a more representative sample for Proposition 4 than for Proposition 8. These were the same voters, in the same polling places, on the same day. Both Proposition 4 and Proposition 8 were hot-button social issues. More often than not, those who supported one proposition support the other, and those who opposed one proposition would oppose the other.
And yet, in all 10 polling places, Proposition 8 fares better relative to Proposition 4 in the official results than in the exit polls, by 5.69% overall. And in 9 of 10 polling places, Proposition 8 fares better in the official results than in the exit polls, by 7.75% overall. Such glaring disparities are a red flag. A serious investigation is warranted.
TABLE 4: COMPARISON OF EXIT POLLS AND OFFICIAL RESULTS FOR
PROPOSITIONS 4 AND 8, ALL TEN POLLING PLACES INDIVIDUALLY
|
Taft |
Official |
LA% |
Exit Poll |
EP% |
Difference |
|
|
|
+3.3% |
|
-0.6% |
3.9% |
|
Ballots Cast |
569 |
|
310 |
|
|
|
Yes 4 |
180 |
33.7% |
99 |
34.6% |
-0.9% |
|
No 4 |
354 |
66.3% |
187 |
65.4% |
|
|
Yes 8 |
206 |
37.0% |
100 |
34.0% |
3.0% |
|
No 8 |
351 |
63.0% |
194 |
66.0% |
|
Long Beach |
Official |
LA% |
Exit Poll |
EP% |
Difference |
|
|
|
+9.4% |
|
-1.1% |
10.5% |
|
Ballots Cast |
603 |
|
353 |
|
|
|
Yes 4 |
291 |
53.7% |
193 |
60.9% |
-7.2% |
|
No 4 |
251 |
46.3% |
124 |
39.1% |
|
|
Yes 8 |
363 |
63.1% |
196 |
59.8% |
3.3% |
|
No 8 |
212 |
36.9% |
132 |
40.2% |
|
Berendo |
Official |
LA% |
Exit Poll |
EP% |
Difference |
|
|
|
+5.2% |
|
-1.1% |
6.3% |
|
Ballots Cast |
690 |
|
423 |
|
|
|
Yes 4 |
324 |
53.9% |
204 |
54.8% |
-0.9% |
|
No 4 |
277 |
46.1% |
168 |
45.2% |
|
|
Yes 8 |
390 |
59.1% |
205 |
53.7% |
5.4% |
|
No 8 |
270 |
40.9% |
177 |
46.3% |
|
Santa Monica |
Official |
LA% |
Exit Poll |
EP% |
Difference |
|
|
|
-1.2% |
|
-3.5% |
2.3% |
|
Ballots Cast |
762 |
|
534 |
|
|
|
Yes 4 |
135 |
19.0% |
72 |
14.9% |
4.1% |
|
No 4 |
575 |
81.0% |
410 |
85.1% |
|
|
Yes 8 |
132 |
17.8% |
58 |
11.4% |
6.4% |
|
No 8 |
610 |
82.2% |
452 |
88.6% |
|
Topanga |
Official |
LA% |
Exit Poll |
EP% |
Difference |
|
|
|
-0.3% |
|
-2.5% |
2.2% |
|
Ballots Cast |
1078 |
|
584 |
|
|
|
Yes 4 |
141 |
13.7% |
48 |
8.7% |
5.0% |
|
No 4 |
888 |
86.3% |
505 |
91.3% |
|
|
Yes 8 |
142 |
13.4% |
35 |
6.2% |
7.2% |
|
No 8 |
917 |
86.6% |
528 |
93.8% |
TABLE 4: COMPARISON OF EXIT POLLS AND OFFICIAL RESULTS FOR
PROPOSITIONS 4 AND 8, ALL TEN POLLING PLACES INDIVIDUALLY (continued)
|
Lockhurst |
Official |
LA% |
Exit Poll |
EP% |
Difference |
|
|
|
+3.2% |
|
+0.4% |
2.8% |
|
Ballots Cast |
1186 |
|
597 |
|
|
|
Yes 4 |
431 |
38.8% |
196 |
34.9% |
3.9% |
|
No 4 |
679 |
61.2% |
366 |
65.1% |
|
|
Yes 8 |
487 |
42.0% |
203 |
35.3% |
6.7% |
|
No 8 |
672 |
58.0% |
372 |
64.7% |
|
Glendale |
Official |
LA% |
Exit Poll |
EP% |
Difference |
|
|
|
+3.6% |
|
-5.3% |
8.9% |
|
Ballots Cast |
1684 |
|
639 |
|
|
|
Yes 4 |
753 |
49.6% |
234 |
40.8% |
8.8% |
|
No 4 |
764 |
50.4% |
340 |
59.2% |
|
|
Yes 8 |
872 |
53.2% |
216 |
35.5% |
17.7% |
|
No 8 |
766 |
46.8% |
392 |
64.5% |
|
Locke |
Official |
LA% |
Exit Poll |
EP% |
Difference |
|
|
|
+9.7% |
|
+7.4% |
2.3% |
|
Ballots Cast |
1137 |
|
733 |
|
|
|
Yes 4 |
505 |
49.1% |
360 |
53.7% |
-4.6% |
|
No 4 |
523 |
50.9% |
310 |
46.3% |
|
|
Yes 8 |
632 |
58.8% |
421 |
61.1% |
-2.3% |
|
No 8 |
443 |
41.2% |
268 |
38.9% |
|
Eagle Rock |
Official |
LA% |
Exit Poll |
EP% |
Difference |
|
|
|
+2.8% |
|
-3.6% |
6.4% |
|
Ballots Cast |
1209 |
|
757 |
|
|
|
Yes 4 |
431 |
37.6% |
234 |
32.7% |
4.9% |
|
No 4 |
714 |
62.4% |
481 |
67.3% |
|
|
Yes 8 |
480 |
40.4% |
214 |
29.1% |
11.3% |
|
No 8 |
709 |
59.6% |
521 |
70.9% |
|
Lynwood |
Official |
LA% |
Exit Poll |
EP% |
Difference |
|
|
|
+3.1% |
|
-5.5% |
8.6% |
|
Ballots Cast |
2736 |
|
1396 |
|
|
|
Yes 4 |
1495 |
58.7% |
762 |
60.4% |
-1.7% |
|
No 4 |
1053 |
41.3% |
499 |
39.6% |
|
|
Yes 8 |
1621 |
61.8% |
712 |
54.9% |
6.9% |
|
No 8 |
1004 |
38.2% |
584 |
45.1% |
According to the official results, Proposition 8 was defeated by 599,602 votes statewide. Los Angeles County comprised 24.23% of the electorate for Proposition 8, with 3,246,959 persons voting on it (see Table 5). If 5.69 to 7.75% of the votes on Proposition 8 in Los Angeles County were shifted from one column to the other, from “no” to “yes,” as suggested by the exit polls in ten different polling places, this would affect the margin (the point spread) by twice those percentages, by some 370,000 to 500,000 votes. And if the vote count was altered elsewhere in the state, the will of the voters may have been reversed.
TABLE 5: OFFICIAL RESULTS IN LOS ANGELES COUNTY AND STATEWIDE
|
|
Yes 4 |
% |
No 4 |
% |
Yes 8 |
% |
No 8 |
% |
|
|
|
|
|
|
|
|
|
|
|
Los Angeles |
1,437,830 |
46.22% |
1,673,251 |
53.78% |
1,624,672 |
50.04% |
1,622,287 |
49.96% |
|
Elsewhere |
4,782,643 |
48.61% |
5,055,227 |
51.39% |
5,376,412 |
52.94% |
4,779,195 |
47.06% |
|
State Totals |
6,220,473 |
48.04% |
6,728,478 |
51.96% |
7,001,084 |
52.24% |
6,401,482 |
47.76% |
A working hypothesis must be that the official results are true and correct, and that the disparities between the exit polls and the official results are due to non-representative samples of voters responding to the exit poll. In order to test this hypothesis, we must compare the demographics (gender, age, race), and the party affiliations, of the voters who participated in the exit polls (the responders) to the voters not responding (the refusals). This underscores the importance of collecting “refusal data,” as was done in this poll. The exit pollsters noted the gender, race, and estimated age of each voter who was approached but declined to respond. These data can be compared to the responses on the questionnaires filled out by the participating voters. Based upon this information, the raw data for the exit poll can be adjusted accordingly, to better reflect the demographic makeup of the electorate.
Gender Bias
When the demographic data from the exit polls are examined, a gender bias is immediately apparent. Among the 5451 responders who identified their gender, 3220 (59.07%) were women, and 2231 (40.93%) were men. This imbalance is found at all ten polling places (see Table 6).
TABLE 6: EXIT POLL RESPONDERS, BY GENDER
|
Polling Place |
Men |
Women |
||
|
|
|
|
|
|
|
Taft |
119 |
42.8% |
159 |
57.2% |
|
Long Beach |
122 |
41.5% |
172 |
58.5% |
|
Berendo |
137 |
39.9% |
206 |
60.1% |
|
Santa Monica |
193 |
39.4% |
297 |
60.6% |
|
Topanga |
212 |
41.5% |
299 |
58.5% |
|
Lockhurst |
234 |
43.7% |
301 |
56.3% |
|
Glendale |
238 |
43.1% |
314 |
56.9% |
|
Locke |
231 |
37.0% |
393 |
63.0% |
|
Eagle Rock |
290 |
43.3% |
379 |
56.7% |
|
Lynwood |
455 |
39.4% |
700 |
60.6% |
|
|
|
|
|
|
|
Total |
2231 |
40.93% |
3220 |
59.07% |
This gender imbalance would obviously have had some effect on the outcome of the exit polls, because the data show a “gender gap” in the vote count. In the ten polling places combined, Proposition 4 gained the support of 41.88% of the men and 39.62% of the women, a differential of 2.26%. Proposition 8 gained the support of 40.48% of the men and 35.84% of the women, a differential of 4.64% (see Table 7).
TABLE 7: EXIT POLL VOTE TOTALS FOR BALLOT PROPOSITIONS, BY GENDER
|
|
Men |
Women |
Unknown |
|||
|
|
|
|
|
|
|
|
|
Yes on 4 |
884 |
41.88% |
1203 |
39.62% |
315 |
48.84% |
|
No on 4 |
1227 |
58.12% |
1833 |
60.38% |
330 |
51.16% |
|
|
|
|
|
|
|
|
|
Yes on 8 |
874 |
40.48% |
1112 |
35.84% |
374 |
52.09% |
|
No on 8 |
1285 |
59.52% |
1991 |
64.16% |
344 |
47.91% |
This “gender gap” appears in 9 of 10 polling places, the lone exception being Long Beach, where women were more likely than men to support both ballot propositions. However, there were some polling places where the differential was insignificant – for example, Proposition 4 at Locke High School and in Lynwood, and Proposition 8 in Santa Monica and Topanga. A detailed breakdown of the vote on the ballot propositions, by gender, age, race and party affiliation, for each polling place, is presented in the Appendix.
Ideally, one would find out how many men and women voted at the polls and adjust the exit poll data accordingly. However, in Los Angeles County, poll books are not available for public inspection, and the Registrar of Voters wants $250 for two countywide files from which it would take weeks to extract the data manually and match up the voter histories with the gender. Under the circumstances, the best approach is to make a conservative assumption, and a 50-50 split meets this requirement because women generally do outnumber men at the polls. Moreover, support for both Proposition 4 and Proposition 8 was greater among men than among women, so adjusting to a 50-50 split will overstate support for both propositions.
To adjust for the “gender gap” is a straightforward mathematical process. Let us begin with a simple hypothetical example not dissimilar to the exit poll data. Suppose there are 25 responders in the exit poll. Only 20 identify their gender, and of these, 12 (60.0%) are women, and 8 (40.0%) are men. The vote count is 17 (68%) to 8 (32%). The breakdown is 9 to 3 among women, 5 to 3 among men, and 3 to 2 among those who did not identify their gender.
To adjust the vote count to a 50%-50% balance by gender, we multiply the numbers for women by 50/60 (or divide by 1.2), and we multiply the numbers for men by 50/40 (or divide by 0.8). I prefer to divide, because the adjustment factors are easy to determine – 1.2 for 60%, 0.8 for 40%, and so on. The adjusted count becomes 7.5 to 2.5 among women, and 6.25 to 3.75 among men, and remains 3 to 2 among those who did not identify their gender. The adjusted total count is now 16.75 (67%) to 8.25 (33%) – not much of a difference (see Table 8).
TABLE 8: HYPOTHETICAL EXIT POLL ADJUSTMENTS
|
|
Yes |
No |
Factor |
Yes |
No |
|
Men = 40% |
5 |
3 |
/ 0.8 |
6.25 |
3.75 |
|
Women = 60% |
9 |
3 |
/ 1.2 |
7.50 |
2.50 |
|
Unknown |
3 |
2 |
|
3.00 |
2.00 |
|
Total |
17 |
8 |
|
16.75 |
8.25 |
Let us suppose, in another hypothetical example, that all women voted one way and all men voted the other way. If the breakdown is 12 to 0 among women, 0 to 8 among men, and 3 to 2 among those who did not identify their gender, for a total vote count of 15 (60%) to 10 (40%), the adjusted count becomes 10 to 0 among women, 0 to 10 among men, and 3 to 2 among those who did not identify their gender, for an adjusted total count of 13 (52%) to 12 (48%) – only an 8% difference (see Table 12). This begins to explain what pollsters mean when they talk about the “margin of error.” There are very real limits as to how inaccurate an exit poll can be (see Table 9).
TABLE 9: HYPOTHETICAL EXIT POLL ADJUSTMENTS
|
|
Yes |
No |
Factor |
Yes |
No |
|
Men = 40% |
0 |
8 |
/ 0.8 |
0 |
10 |
|
Women = 60% |
12 |
0 |
/ 1.2 |
10 |
0 |
|
Unknown |
3 |
2 |
|
3 |
2 |
|
Total |
15 |
10 |
|
13 |
12 |
When this methodology is applied to the exit poll results from Los Angeles County, in order to adjust for the obvious gender imbalance among the responders, we find that it makes very little difference at all (see Table 10). Proposition 8 still fares 7.29% better (instead of 7.75%) in the official results than in the exit polls. Proposition 4 still fares 1.84% better (instead of 2.06%) in the official results than in the exit polls. And the disparities, relative to each other, are still 5.45% (instead of 5.79%).
TABLE 10: COMPARISON OF EXIT POLL DATA, ADJUSTED FOR GENDER,
AND OFFICIAL RESULTS FOR PROPOSITIONS 4 AND 8
|
|
Official |
LA% |
Exit Poll |
EP% |
Difference |
|
|
|
+3.68% |
|
-1.77% |
5.45% |
|
Ballots Cast |
11654 |
|
6326 |
|
|
|
Yes 4 |
4686 |
43.53% |
2415.4 |
41.69% |
1.84% |
|
No 4 |
6078 |
56.47% |
3379.0 |
58.31% |
|
|
Yes 8 |
5325 |
47.21% |
2388.2 |
39.92% |
7.29% |
|
No 8 |
5954 |
52.79% |
3593.8 |
60.08% |
These adjusted numbers are derived from the sum totals of the adjustments calculated for all ten polling places individually. The calculations are set forth in full detail in the Appendix, and the adjusted numbers for each polling place for Propositions 4 and 8 are presented here (see Table 11).
Even with the percentages adjusted to account for gender imbalance, Proposition 8 still runs better in the official results than in the exit polls in 9 of 10 polling places, by as much as 17.3% in Glendale, 11.1% in Eagle Rock, 7.1% in Topanga, 6.3% in Santa Monica, and 6.3% at Lockhurst. Proposition 8 still runs better relative to Proposition 4 in the official results than in the exit polls in all ten polling places, by as much as 10.2% in Long Beach, 8.9% in Glendale, 7.7% in Lynwood, 6.7% in Berendo, and 6.5% in Eagle Rock (see Table 11).
Thus it is shown that the glaring disparities between the exit polls and the official results for Proposition 8 are simply not attributable to “gender bias” in the exit polls.
TABLE 11: COMPARISON OF ADJUSTED EXIT POLL DATA, ADJUSTED FOR GENDER, AND OFFICIAL RESULTS FOR PROPOSITIONS 4 AND 8
|
Taft |
Official |
LA% |
Exit Poll |
EP% |
Difference |
|
|
|
+3.3% |
|
-0.2% |
3.5% |
|
Ballots Cast |
569 |
|
310 |
|
|
|
Yes 4 |
180 |
33.7% |
99.4 |
34.8% |
-1.1% |
|
No 4 |
354 |
66.3% |
186.1 |
65.2% |
|
|
Yes 8 |
206 |
37.0% |
101.7 |
34.6% |
2.4% |
|
No 8 |
351 |
63.0% |
192.6 |
65.4% |
|
Long Beach |
Official |
LA% |
Exit Poll |
EP% |
Difference |
|
|
|
+9.4% |
|
-0.8% |
10.2% |
|
Ballots Cast |
603 |
|
353 |
|
|
|
Yes 4 |
291 |
53.7% |
191.9 |
60.4% |
-6.7% |
|
No 4 |
251 |
46.3% |
125.9 |
39.6% |
|
|
Yes 8 |
363 |
63.1% |
195.7 |
59.6% |
3.5% |
|
No 8 |
212 |
36.9% |
132.4 |
40.4% |
|
Berendo |
Official |
LA% |
Exit Poll |
EP% |
Difference |
|
|
|
+5.2% |
|
-1.5% |
6.7% |
|
Ballots Cast |
690 |
|
423 |
|
|
|
Yes 4 |
324 |
53.9% |
207.5 |
55.7% |
-1.8% |
|
No 4 |
277 |
46.1% |
165.2 |
44.3% |
|
|
Yes 8 |
390 |
59.1% |
205.9 |
54.2% |
4.9% |
|
No 8 |
270 |
40.9% |
174.3 |
45.8% |
|
Santa Monica |
Official |
LA% |
Exit Poll |
EP% |
Difference |
|
|
|
-1.2% |
|
-3.9% |
2.7% |
|
Ballots Cast |
762 |
|
534 |
|
|
|
Yes 4 |
135 |
19.0% |
74.2 |
15.4% |
3.6% |
|
No 4 |
575 |
81.0% |
406.6 |
84.6% |
|
|
Yes 8 |
132 |
17.8% |
58.5 |
11.5% |
6.3% |
|
No 8 |
610 |
82.2% |
451.6 |
88.5% |
|
Topanga |
Official |
LA% |
Exit Poll |
EP% |
Difference |
|
|
|
-0.3% |
|
-2.5% |
2.2% |
|
Ballots Cast |
1078 |
|
584 |
|
|
|
Yes 4 |
141 |
13.7% |
48.7 |
8.8% |
4.9% |
|
No 4 |
888 |
86.3% |
505.0 |
91.2% |
|
|
Yes 8 |
142 |
13.4% |
35.5 |
6.3% |
7.1% |
|
No 8 |
917 |
86.6% |
527.6 |
93.7% |
TABLE 11: COMPARISON OF ADJUSTED EXIT POLL DATA, ADJUSTED FOR GENDER, AND OFFICIAL RESULTS FOR PROPOSITIONS 4 AND 8 (continued)
|
Lockhurst |
Official |
LA% |
Exit Poll |
EP% |
Difference |
|
|
|
+3.2% |
|
+0.7% |
2.5% |
|
Ballots Cast |
1186 |
|
597 |
|
|
|
Yes 4 |
431 |
38.8% |
197.1 |
35.0% |
3.8% |
|
No 4 |
679 |
61.2% |
365.4 |
65.0% |
|
|
Yes 8 |
487 |
42.0% |
205.2 |
35.7% |
6.3% |
|
No 8 |
672 |
58.0% |
370.1 |
64.3% |
|
Glendale |
Official |
LA% |
Exit Poll |
EP% |
Difference |
|
|
|
+3.6% |
|
-5.3% |
8.9% |
|
Ballots Cast |
1684 |
|
639 |
|
|
|
Yes 4 |
753 |
49.6% |
236.4 |
41.2% |
8.4% |
|
No 4 |
764 |
50.4% |
337.5 |
58.8% |
|
|
Yes 8 |
872 |
53.2% |
218.7 |
35.9% |
17.3% |
|
No 8 |
766 |
46.8% |
390.7 |
64.1% |
|
Locke |
Official |
LA% |
Exit Poll |
EP% |
Difference |
|
|
|
+9.7% |
|
+8.1% |
1.6% |
|
Ballots Cast |
1137 |
|
733 |
|
|
|
Yes 4 |
505 |
49.1% |
361.9 |
53.8% |
-4.7% |
|
No 4 |
523 |
50.9% |
310.5 |
46.2% |
|
|
Yes 8 |
632 |
58.8% |
426.7 |
61.9% |
-3.1% |
|
No 8 |
443 |
41.2% |
263.1 |
38.1% |
|
Eagle Rock |
Official |
LA% |
Exit Poll |
EP% |
Difference |
|
|
|
+2.8% |
|
-3.7% |
6.5% |
|
Ballots Cast |
1209 |
|
757 |
|
|
|
Yes 4 |
431 |
37.6% |
235.8 |
33.0% |
4.6% |
|
No 4 |
714 |
62.4% |
478.1 |
67.0% |
|
|
Yes 8 |
480 |
40.4% |
214.9 |
29.3% |
11.1% |
|
No 8 |
709 |
59.6% |
519.8 |
70.7% |
|
Lynwood |
Official |
LA% |
Exit Poll |
EP% |
Difference |
|
|
|
+3.1% |
|
-4.6% |
7.7% |
|
Ballots Cast |
2736 |
|
1396 |
|
|
|
Yes 4 |
1495 |
58.7% |
762.5 |
60.5% |
-1.8% |
|
No 4 |
1053 |
41.3% |
498.7 |
39.5% |
|
|
Yes 8 |
1621 |
61.8% |
725.4 |
55.9% |
5.9% |
|
No 8 |
1004 |
38.2% |
571.6 |
44.1% |
Age and Race Bias
To examine the possibility that the disparities between the exit polls and the official results are due to non-representative samples with respect to age or race, it is useful to examine the voting patterns of these demographic groups as set forth in detail in the Appendix. Presented here are summary tables for all 10 polling places combined. Bear in mind that the characteristics of the electorate will vary among the different polling places.
With respect to Proposition 4, (which would have required parental notification and a waiting period before termination of a minor’s pregnancy), the age of the voter made almost no difference. In the exit poll, Proposition 4 was supported by 40.1% of voters under 30, 40.1% of voters between 30 and 59, and 41.8% of voters aged 60 or older. But support for Proposition 8 (that is, opposition to same-sex marriage), was clearly correlated with age. Proposition 8 was supported by 31.7% of voters under 30, 38.8% of voters between 30 and 59, and 48.5% of voters aged 60 or older (see Table 12). Thus, an oversampling of voters under 30, or an undersampling of voters over 60, or both, would cause the exit poll to understate the support for Proposition 8.
TABLE 12: EXIT POLL RESULTS FOR PROPOSITIONS 4 AND 8,
BY AGE GROUP, ALL TEN POLLING PLACES COMBINED
|
|
18-29 |
30-59 |
60+ |
|||
|
|
|
|
|
|
|
|
|
Yes on 4 |
586 |
40.1% |
1222 |
40.1% |
333 |
41.8% |
|
No on 4 |
875 |
59.9% |
1824 |
59.9% |
463 |
58.2% |
|
|
|
|
|
|
|
|
|
Yes on 8 |
475 |
31.7% |
1210 |
38.8% |
401 |
48.5% |
|
No on 8 |
1023 |
68.3% |
1911 |
61.2% |
426 |
51.5% |
With respect to Propositions 4 and 8, the race of the voter did make a difference, most obviously with white voters, among whom the vote was 81.2% against Proposition 4 and 82.8% against Proposition 8 (see Table 13). Clearly, this is not a representative sample of white voters in Los Angeles County as a whole, although it could be representative of these 10 polling places, which include some of the most liberal communities in the county (e.g. Topanga and Santa Monica). It is an unfortunate shortcoming of the exit poll that no predominantly Republican areas were covered. But this does not invalidate the results. It only means that in these 10 polling places, an undersampling of white voters would overstate the support for Propositions 4 and 8, and that an oversampling of white voters would overstate the opposition.
Among the other races identified in both the exit poll questionnaires and the refusal data, support for Proposition 4 was strongest among Latinos, from whom it received 56.9% of the vote, compared to 51.3% among blacks and 50.1% among Asians (see Table 13). Thus, an undersampling of Latino voters could have understated the support for Proposition 4, but probably not by enough to make much of a difference.
Support for Proposition 8 was strongest among black voters, from whom it received 60.5% of the vote, compared to 48.8% among Latinos and 45.7% among Asians (see Table 13). Blacks
were the only racial group among whom the support for Proposition 8 was stronger than for Proposition 4.
As stated above, 66.53% of the electorate voted the same way on both propositions. Those who voted for Proposition 4 and against Proposition 8 amounted to 17.7% of Latinos, 13.5% of blacks, and 13.4% of Asians. But 21.4% (208 of 970) black voters made the opposite choices, supporting Proposition 8 while opposing Proposition 4, whereas only 10.6% of Latinos (193 of 1828) and 9.6% of Asians (55 of 571) did so (these data are set forth in detail in the Appendices).
Thus, an undersampling of black voters would understate support for Proposition 8, whereas an undersampling of Latinos relative to Asians, or vice versa, would have made little difference.
TABLE 13: EXIT POLL RESULTS FOR PROPOSITIONS 4 AND 8,
BY RACE, ALL TEN POLLING PLACES COMBINED
|
|
Latino |
Black |
White |
Asian |
||||
|
|
|
|
|
|
|
|
|
|
|
Yes on 4 |
994 |
56.9% |
456 |
51.3% |
191 |
18.8% |
259 |
50.1% |
|
No on 4 |
753 |
43.1% |
433 |
48.7% |
824 |
81.2% |
258 |
49.9% |
|
|
|
|
|
|
|
|
|
|
|
Yes on 8 |
864 |
48.8% |
553 |
60.5% |
178 |
17.2% |
249 |
45.7% |
|
No on 8 |
907 |
51.2% |
361 |
39.5% |
856 |
82.8% |
296 |
54.3% |
Demographic information on the voters not responding to the exit poll, known as “refusal data,” was collected at 6 of 10 polling places (Taft, Santa Monica, Topanga, Lockhurst, Eagle Rock, and Lynwood). These include 4 of the 5 polling places with the greatest disparities between the exit polls and the official results for Proposition 8.
TAFT
At Taft High School there was a 6.0% disparity between the margins of defeat (the point spreads) for Proposition 8 in the exit poll and in the official results. Proposition 8 was defeated by 194 (66.0%) to 100 (34.0%) in the exit poll, and by 351 (63.0%) to 206 (37.0%) in the official results (see Table 4). Among non-responders, Proposition 8 was defeated much more narrowly, by 157 (59.7%) to 106 (40.3%), or else the official results are not true and correct.
The refusal data for Taft High School show that the exit poll sample was quite representative with respect to age group (see Table 14). However, white voters were severely underrepresented (by 19.2%), while Latinos, blacks, and Asians were all overrepresented (by 2.2%, 4.9%, and 12.0%, respectively). This was the most extreme imbalance reflected in the refusal data for any of the six polling places. Altogether, 212 white voters refused to participate in the exit poll; these represented nearly two-thirds of the white voters (22 of 321, or 66.0%), and nearly all of the refusals (212 of 226, or 93.8%). As it happens, 120 of the 212 (57.5%) were men, whereas 57 of 95 (60.0%) white responders were women (among those who revealed both race and gender).
TABLE 14: EXIT POLL RESPONDERS AND REFUSAL DATA, TAFT
|
Taft |
Totals |
18-29 |
30-59 |
60+ |
White |
Latino |
Black |
Asian |
|
|
|
|
|
|
|
|
|
|
|
Responders |
310 |
54 |
172 |
68 |
109 |
10 |
19 |
47 |
|
|
18.3% |
58.5% |
23.1% |
58.9% |
5.4% |
10.3% |
25.4% |
|
|
|
|
|
|
|
|
|
|
|
|
Refusals |
230 |
51 |
119 |
60 |
212 |
3 |
3 |
8 |
|
|
22.1% |
51.7% |
26.1% |
93.8% |
1.3% |
1.3% |
3.5% |
|
|
|
|
|
|
|
|
|
|
|
|
Totals |
540 |
105 |
291 |
128 |
321 |
13 |
22 |
55 |
|
|
20.0% |
55.5% |
24.4% |
78.1% |
3.2% |
5.4% |
13.4% |
The “gender bias” at all 10 polling places has already been addressed. At Taft, adjustment of the sample to a 50%-50% gender balance showed a 0.6% rise in support for Proposition 8 and a 0.2% rise for Proposition 4.
However, adjustment of the exit poll sample according to race has a greater effect, and in the opposite direction. Of the 47 exit poll responders who identified themselves as Asian, 21 (48%) voted for Proposition 8, and 23 (52%) voted against it (three made no choice). Of the 19 exit poll responders who identified themselves as black, 8 (42%) voted for Proposition 8, and 11 (58%) voted against it. Of the 10 exit poll responders who identified themselves as Latino, 4 (44%) voted for Proposition 8, and 5 (56%) voted against it (one made no choice).
These percentages being nearly equal, and the numbers being small, an oversampling or undersampling of Asians, blacks or Latinos, relative to each other, would have little effect upon the results.
But an undersampling of white voters would have understated the opposition to Proposition 8 because, of the 109 exit poll responders who identified themselves as white, only 35 (33%) voted for Proposition 8, and 71 (67%) voted against it (three made no choice).
If we adjust the exit poll results by race, using the same methodology shown above for adjustment by gender, the end result is 32.6% for Proposition 8, and 67.4% against it. This represents a 1.4% drop in support for Proposition 8, and increases the disparity between the exit poll and the official results from 6.0% to 8.8% (the mathematics are shown in detail in the Appendix).
SANTA MONICA
At Santa Monica there was a 12.8% disparity between the margins of defeat (the point spreads) for Proposition 8 in the exit poll and in the official results. Proposition 8 was defeated by 452 (88.6%) to 58 (11.4%) in the exit poll, and by 610 (82.2%) to 132 (17.8%) in the official results (see Table 4). Among non-responders, Proposition 8 was defeated much more narrowly than among responders, by 158 (68.1%) to 74 (31.9%), or else the official results are not true and correct.
According to the official results there were 762 ballots cast at the polls. There were 534 responders to the exit poll and, according to the refusal data, there were 237 refusals, for a total of 771 – a discrepancy of nine voters (there may have been only 228 refusals). But though the refusal data may not be precisely correct, all but 23 (9.7%) of those refusing were described as white (11 were Latino, 11 were Asian, and one was black). Nearly half of white voters, 214 of 433 (49.4%) refused to participate; 107 were men and 107 were women. Based upon the refusal data, whites were underrepresented by 8.6% in the exit poll. Latinos, blacks and Asians were overrepresented by 1.0%, 1.3%, and 6.3%, respectively. (See Table 15)
TABLE 15: EXIT POLL RESPONDERS AND REFUSAL DATA, SANTA MONICA
|
Santa Monica |
Totals |
18-29 |
30-59 |
60+ |
White |
Latino |
Black |
Asian |
|
|
|
|
|
|
|
|
|
|
|
Responders |
534 |
100 |
325 |
77 |
219 |
21 |
11 |
60 |
|
|
19.9% |
64.5% |
15.3% |
70.4% |
6.8% |
3.5% |
19.3% |
|
|
|
|
|
|
|
|
|
|
|
|
Refusals |
237 |
20 |
182 |
34 |
214 |
11 |
1 |
11 |
|
|
8.5% |
77.1% |
14.4% |
90.3% |
4.6% |
0.4% |
4.6% |
|
|
|
|
|
|
|
|
|
|
|
|
Totals |
771 |
120 |
507 |
111 |
433 |
32 |
12 |
71 |
|
|
16.3% |
68.7% |
15.0% |
79.0% |
5.8% |
2.2% |
13.0% |
Regarding Proposition 8, the demographic data do not explain how 31.9% of all the non-responders at Santa Monica could have voted for the ban on same-sex marriage. In the exit poll, only 11.4% voted in favor. There was no demographic group within which support for Proposition 8 even approached 31.9%, the strongest support, 17 of 77 (22.1%), coming from voters aged 60 or older. Among ethnic groups, the strongest support, 10 of 60 (16.7%), came from Asians.
TOPANGA
At Topanga there was a 14.4% disparity between the margins of defeat (the point spreads) for Proposition 8 in the exit poll and in the official results. Proposition 8 was defeated by 528 (93.8%) to 35 (6.2%) in the exit poll, and by 917 (86.6%) to 142 (13.4%) in the official results (see Table 4). Among non-responders, Proposition 8 was defeated much more narrowly than among responders, by 389 (78.4%) to 107 (21.5%), or else the official results are not true and correct.
The refusal data for Topanga seem entirely trustworthy. Officially there were 1078 ballots cast at the polls (not including 99 absentee ballots). Of these, 822 voters were approached by the exit pollsters; there were 584 responders, and 238 refusals. According to the refusal data, voters under 30 were underrepresented by 3.5% in the exit poll, and voters between 30 and 59 were overrepresented by 4.1%. The refusal data show that the sample was quite representative with respect to race (see Table 16).
TABLE 16: EXIT POLL RESPONDERS AND REFUSAL DATA, TOPANGA
|
Topanga |
Totals |
18-29 |
30-59 |
60+ |
White |
Latino |
Black |
Asian |
|
|
|
|
|
|
|
|
|
|
|
Responders |
584 |
61 |
342 |
107 |
237 |
21 |
7 |
16 |
|
|
12.0% |
67.1% |
21.0% |
84.3% |
7.5% |
2.5% |
5.7% |
|
|
|
|
|
|
|
|
|
|
|
|
Refusals |
238 |
55 |
129 |
54 |
191 |
19 |
9 |
19 |
|
|
23.1% |
54.2% |
22.7% |
80.3% |
8.0% |
3.8% |
8.0% |
|
|
|
|
|
|
|
|
|
|
|
|
Totals |
822 |
116 |
471 |
161 |
428 |
40 |
16 |
35 |
|
|
15.5% |
63.0% |
21.5% |
82.5% |
7.7% |
3.1% |
6.7% |
Regarding Proposition 8, the demographic data do not explain how 21.5% of all the non-responders at Topanga could have voted for the ban on same-sex marriage. In the exit poll, only 6.2% voted in favor. The strongest support, 17 of 107 (15.9%), was among voters aged 60 or older. Among ethnic groups, the strongest support, 3 of 16 (18.8%), came from Asians.
LOCKHURST
At Lockhurst Elementary School there was a 13.4% disparity between the margins of defeat (the point spreads) for Proposition 8 in the exit poll and in the official results. Proposition 8 was defeated by 372 (64.7%) to 203 (35.3%) in the exit poll, and by 672 (58.0%) to 487 (42.0%) in the official results (see Table 4). Among non-responders, Proposition 8 was defeated much more narrowly than among responders, by 300 (51.4%) to 284 (48.6%), or else the official results are not true and correct.
The refusal data for Lockhurst seem entirely trustworthy. Officially there were 1186 ballots cast at the polls (not including 180 absentee ballots). Of these, 831 voters were approached by the exit pollsters; there were 596 responders, and 235 refusals. According to the refusal data, voters under 30, and voters over 60, were underrepresented in the exit poll (by 2.0% and 3.3%, respectively), and voters between 30 and 59 were overrepresented (by 5.3%). Latino voters were underrepresented by 2.4% and black voters were overrepresented by 2.0% (see Table 17).
TABLE 17: EXIT POLL RESPONDERS AND REFUSAL DATA, LOCKHURST
|
Lockhurst |
Totals |
18-29 |
30-59 |
60+ |
White |
Latino |
Black |
Asian |
|
|
|
|
|
|
|
|
|
|
|
Responders |
596 |
100 |
344 |
111 |
160 |
66 |
27 |
83 |
|
|
18.0% |
62.0% |
20.0% |
47.6% |
19.6% |
8.0% |
24.7% |
|
|
|
|
|
|
|
|
|
|
|
|
Refusals |
235 |
58 |
104 |
73 |
111 |
58 |
7 |
51 |
|
|
24.7% |
44.3% |
31.1% |
48.9% |
25.6% |
3.1% |
22.5% |
|
|
|
|
|
|
|
|
|
|
|
|
Totals |
831 |
158 |
448 |
184 |
271 |
124 |
34 |
134 |
|
|
20.0% |
56.7% |
23.3% |
48.1% |
22.0% |
6.0% |
23.8% |
Support for Proposition 8 was strongest among black voters, of whom 12 of 26 (46.2%) voted for the ban on same-sex marriage. Support was 46 of 157 (29.3%) among whites, 24 of 66 (36.3%) among Latinos, and 27 of 79 (34.2%) among Asians. Thus, an oversampling of black voters would overstate the support for Proposition 8. When the numbers are adjusted with respect to race, the result is 35.2% Yes and 64.8% No, a change of only 0.1%. When we adjust the numbers for Proposition 4, the result is 34.9% Yes and 65.1% No, which is no change at all (the mathematics are shown in detail in the Appendix).
Proposition 8 was supported by 27 of 100 (27.0%) of voters under 30, 111 of 344 (32.3%) of voters between 30 and 59, and 43 of 111 (38.7%) of voters aged 60 or older. Thus, the undersampling of voters with respect to age group involved both extremes (27.0% and 38.7%). When we adjust the numbers accordingly, the result is 35.4% Yes and 64.6% No, a change of only 0.1%. Similarly, when we adjust the numbers for Proposition 4, the result is 34.7% Yes and 65.3% No, a change of only 0.2% (the mathematics are shown in detail in the Appendix).
EAGLE ROCK
At Eagle Rock there was a 22.6% disparity between the margins of defeat (the point spreads) for Proposition 8 in the exit poll and in the official results. Proposition 8 was defeated by 521 (70.9%) to 214 (29.1%) in the exit poll, and by 709 (59.6%) to 480 (40.4%) in the official results (see Table 4). Among all non-responders, Proposition 8 must have passed overwhelmingly, by 266 (58.6%) to 188 (41.4%), or else the official results are not true and correct. How this could have happened cannot be explained by the demographic data. In the exit poll, the strongest support for Proposition 8 was 67 of 128 (52.3%) among Asians, 51 of 127 (40.2%) among voters aged 60 and older, and 53 of 161 (32.9%) among Hispanics.
The refusal data for Eagle Rock seem entirely trustworthy. Officially there were 1209 ballots cast at the polls (not including 111 absentee ballots). Of these, 1090 voters were approached by the exit pollsters; there were 757 responders, and 333 refusals. According to the refusal data, voters between 30 and 59 were overrepresented by 2.5% in the exit poll, and voters aged 60 and older were underrepresented by 3.1%. Latino voters were overrepresented by 3.1% and white voters were underrepresented by 4.8% (see Table 18).
TABLE 18: EXIT POLL RESPONDERS AND REFUSAL DATA, EAGLE ROCK
|
Eagle Rock |
Totals |
18-29 |
30-59 |
60+ |
White |
Latino |
Black |
Asian |
|
|
|
|
|
|
|
|
|
|
|
Responders |
757 |
125 |
440 |
133 |
185 |
164 |
15 |
132 |
|
|
17.9% |
63.0% |
19.1% |
37.2% |
33.1% |
3.0% |
26.6% |
|
|
|
|
|
|
|
|
|
|
|
|
Refusals |
333 |
53 |
184 |
96 |
160 |
83 |
7 |
76 |
|
|
15.9% |
55.3% |
28.8% |
49.1% |
25.5% |
2.1% |
23.3% |
|
|
|
|
|
|
|
|
|
|
|
|
Totals |
1090 |
178 |
624 |
229 |
345 |
247 |
22 |
208 |
|
|
17.3% |
60.5% |
22.2% |
42.0% |
30.0% |
2.7% |
25.3% |
An oversampling of Latinos (and a slight oversampling of Asians) would have overstated the support for Proposition 8. In the exit poll, support for Proposition 8 was 53 of 161 (32.9%) among Latinos, compared to 24 of 184 (13.0%) among whites, 3 of 15 (20.0%) among blacks, and 67 of 128 (52.3%) among Asians.
When we adjust the numbers by race, the result is 28.3% Yes and 71.7% No, a change of 0.8% in both columns, and the disparity between the margins of defeat for Proposition 8 in the exit poll and the official results increases to 24.2%. When we adjust the numbers for Proposition 4, the result is 31.8% Yes and 68.2% No, a change of 0.9% in both columns, and the disparity between the margins of defeat for Proposition 4 in the exit poll and the official results increases to 11.6% (the mathematics are shown in detail in the Appendix).
In the exit poll, support for Proposition 8 was 20 of 122 (16.4%) among voters under 30, 118 of 435 (27.1%) of voters between 30 and 59, and 51 of 127 (40.2%) among voters aged 60 and older. Thus, if voters aged 60 or older were underrepresented in the exit poll it would have understated the support for Proposition 9.
When we adjust the numbers according to age, the result is 29.5% Yes and 70.5% No, a change of 0.4% in both columns, and the disparity between the margins of defeat for Proposition 4 in the exit poll and the official results decreases to 21.8%. When we adjust the numbers for Proposition 4, the result is 33.0% Yes and 67.0% No, a change of 0.3% in both columns, and the disparity between the margins of defeat for Proposition 4 in the exit poll and the official results decreases to 9.2% (the mathematics are shown in detail in the Appendix).
Thus, adjusting the exit poll data according to race changes the results in one direction, and adjusting the exit poll data according to age changes the results in the other direction. But none of the changes come close to accounting for the disparities between the exit polls and the official results.
LYNWOOD
At Lynwood there was a 13.8% disparity between the margins of victory (the point spreads) for Proposition 8 in the exit poll and in the official results. Proposition 8 was approved by 712 (54.9%) to 584 (45.1%) in the exit poll, and by 1621 (61.8%) to 1004 (38.2%). (See Table 4) Among all non-responders, Proposition 8 must have passed overwhelmingly, by 909 (68.4%) to 420 (31.6%), or else the official results are not true and correct.
The refusal data for Lynwood seem entirely trustworthy. Officially there were 2736 ballots cast at the polls (not including 176 absentee ballots). Of these, 1932 voters were approached by the exit pollsters; there were 1396 responders, and 536 refusals (see Table 19).
TABLE 19: EXIT POLL RESPONDERS AND REFUSAL DATA, LYNWOOD
|
Lynwood |
Totals |
18-29 |
30-59 |
60+ |
White |
Latino |
Black |
Asian |
|
|
|
|
|
|
|
|
|
|
|
Responders |
1396 |
500 |
563 |
122 |
14 |
804 |
331 |
9 |
|
|
42.2% |
47.5% |
10.3% |
1.2% |
69.4% |
28.6% |
0.8% |
|
|
|
|
|
|
|
|
|
|
|
|
Refusals |
536 |
115 |
315 |
106 |
20 |
266 |
123 |
50 |
|
|
21.4% |
58.8% |
19.8% |
4.4% |
58.0% |
26.8% |
10.9% |
|
|
|
|
|
|
|
|
|
|
|
|
Totals |
1932 |
615 |
878 |
228 |
34 |
1070 |
454 |
59 |
|
|
35.7% |
51.0% |
13.2% |
2.1% |
66.2% |
28.1% |
3.6% |
In the exit poll, support for Proposition 8 was 341 to 205 (62.5%) among voters between 30 and 59, and 83 to 31 (72.8%) among voters aged 60 or older. Among voters under 30, Proposition 8 was defeated, losing by 195 to 287 (40.4%). The refusal data show that voters under 30 were overrepresented by 6.5%, and that voters between 30 and 59 and voters aged 60 or older were underrepresented by 3.5% and 2.9%, respectively (see Table 26). This would have substantially understated the support for Proposition 8. If we adjust the numbers according to age, the result is 56.4% Yes and 43.6% No, a change of 1.5% in both columns, which reduces the disparity to 10.8% (the mathematics are shown in detail in the Appendix).
In the exit poll, support for Proposition 8 was 412 to 372 (52.6%) among Latinos, 190 to 125 (60.3%) among blacks, 7 to 6 (54%) among whites, and 6 to 1 (86%) among Asians. The refusal data show that blacks were proportionately represented in the exit poll (see Table 26). But the refusal data do show that 50 of 59 Asians who were approached refused to participate, so that Asians were underrepresented by 2.8% in the exit poll, while only 266 of 1070 Latinos who were approached refused to participate, so that Latinos were overrepresented by 3.2% in the exit poll.
It is possible to adjust the numbers according to race, in an attempt to rectify this imbalance, although the result, being based upon a sample of only nine Asian voters (and only 14 white voters), is inherently imprecise. The result is 55.6% Yes and 44.4% No, a change of 0.7% in both columns, which reduces the disparity to 12.4% (the mathematics are shown in detail in the Appendix).
The exit poll adjustments at Lynwood amounted to 1.0% for gender, and 1.5% for age, and 0.7% for race. We have no direct way to adjust the exit poll data according to age, race, and gender combined. But even if these adjustments are compounded, the result is a change of 3.2% in both columns, which still leaves a disparity of 7.4% between the margins of victory for Proposition 8 in the exit poll and in the official results.
Thus it is shown through exhaustive analysis that the disparities between the exit polls and the official results, which turn up consistently in the vote count for both the presidential election and for Proposition 8, cannot be attributed to gender bias, age bias, or racial bias in the samples of voters polled. There seem to be only two possible explanations remaining. Either the samples were not representative with respect to party affiliation, or the official results are not true and corre
Party Affiliation
For those refusing to participate in exit polls, gender can be determined, race observed, and age approximated, by the pollsters themselves. But this is not true of party affiliation. One cannot tell from appearance if the person refusing is a Republican or a Democrat. Sometimes the only way to determine the party affiliation of the refusals is to examine the poll books, tally up the numbers of voters from each party who voted at the polls, calculate their percentages, and compare them with the data from the exit poll. If party affiliation is not listed in the poll books they must be compared with the voter rolls, making the process even more time-consuming. In this way it can be determined if the sample of voters polled was representative with respect to party affiliation. Failure to do this, for whatever reason, is a serious deficiency in the art of exit polling.
Poll books are simply not available for inspection on Election Night, which is why exit poll results are not adjusted in a timely manner with regard to party affiliation. Tallies of the party affiliations of those actually voting at the polls can be collected on Election Day by having poll watchers, with “walking lists” showing party affiliation, stationed inside the polling place, checking off the names of voters who sign in at the polls, while the exit pollsters are outside the polling place interviewing voters. This could have the undesired effect of inhibiting voters from participating in the exit polls, out of concern that the questionnaires they fill out will not remain anonymous.
In some jurisdictions, the party affiliations of the actual voters are compiled and provided by the election officials themselves. Also there are private companies who maintain voter data bases from which such data can be gleaned.
We knew that the disparities observed between the exit polls and the official results at the polling places in Los Angeles County might not be due to an erroneous or fraudulent official vote count. They might just as easily have been caused by disproportionate numbers of Republican voters refusing to participate in the exit polls. This would have caused support for John McCain and for both ballot propositions to be understated in the exit poll results.
One of the questions addressed in this study, and one of the very purposes of exit polling, is to determine if the official results are true and correct. Therefore, even though McCain got only 13.48% of the vote in the exit polls, compared to 18.72% in the official results for the same 10 polling places, we could not assume that McCain voters were undersampled in the exit polls, and that the official results were true and correct. But neither could we assume that the exit polls were accurate, and that the official results were fraudulent. All conclusions derived from unwarranted assumptions are likewise unwarranted. This made it all the more important to find out if registered Republicans were undersampled in the exit poll, which is quite possible to do, because party registration is a matter of record.
In the exit polls, at the 10 polling places combined, there were 6326 responders. Of these, 4174 (65.98%) were Democrats, and only 646 (10.21%) were Republicans; 331 (5.23%) identified another party (Green, Libertarian, Peace and Freedom, or American Independent), and 1175 (18.57%) checked none or declined to state. The percentage of Republicans among the responders ranged from 2.2% at Locke High School to 25.5% at Taft High School (see Table 20).
It was necessary to compare these rather low percentages of Republican responders to the true percentages of registered Republicans who voted at the polls, and to adjust the exit poll data accordingly.
TABLE 20: PARTY AFFILIATION OF EXIT POLL RESPONDERS
|
|
Democrat |
Republican |
Other |
None |
||||
|
|
|
|
|
|
|
|
|
|
|
Taft |
170 |
54.8% |
79 |
25.5% |
12 |
3.9% |
49 |
15.8% |
|
Long Beach |
229 |
64.9% |
39 |
11.0% |
19 |
5.4% |
66 |
18.7% |
|
Berendo |
279 |
66.0% |
43 |
10.2% |
12 |
2.8% |
89 |
21.0% |
|
Santa Monica |
356 |
66.7% |
56 |
10.5% |
27 |
5.1% |
95 |
17.8% |
|
Topanga |
388 |
66.4% |
21 |
3.6% |
61 |
10.4% |
114 |
19.5% |
|
Lockhurst |
317 |
53.1% |
134 |
22.4% |
51 |
8.5% |
95 |
15.9% |
|
Glendale |
352 |
55.1% |
85 |
13.3% |
42 |
6.6% |
160 |
25.0% |
|
Locke |
587 |
80.1% |
16 |
2.2% |
20 |
2.7% |
110 |
15.0% |
|
Eagle Rock |
482 |
63.7% |
108 |
14.3% |
44 |
5.8% |
123 |
16.2% |
|
Lynwood |
1014 |
72.6% |
65 |
4.7% |
43 |
3.1% |
274 |
19.6% |
|
|
|
|
|
|
|
|
|
|
|
Total |
4174 |
65.98% |
646 |
10.21% |
331 |
5.23% |
1175 |
18.57% |
In Los Angeles County the election results, precinct by precinct, are updated numerous times during the weeks following an election. This was especially necessary in 2008 because, according to the Office of Elections, there were so many newly registered voters that not all the information could be entered into the voter database in a timely manner. Many of these voters had to cast provisional ballots, and until the official voter database was completed, those ballots could not be counted because their validity could not be determined. For this reason, the numbers in the voter databases of the private companies may not precisely match the final official results, but they are close enough because we are dealing with party affiliation as percentages, not as raw data.
The proper comparison is with voters at the polls, not with total ballots cast, because absentee voters are not included in the exit poll data. The breakdown of voters at the polls, by party affiliation, is given below (see Table 21).
TABLE 21: PARTY AFFILIATION OF VOTERS AT THE POLLS
|
|
Democrat |
Republican |
Other |
None |
||||
|
|
|
|
|
|
|
|
|
|
|
Taft |
259 |
48.6% |
158 |
29.6% |
17 |
3.2% |
99 |
18.6% |
|
Long Beach |
339 |
60.8% |
93 |
16.7% |
25 |
4.5% |
101 |
18.1% |
|
Berendo |
422 |
65.7% |
86 |
13.4% |
21 |
3.3% |
113 |
17.6% |
|
Santa Monica |
420 |
59.2% |
105 |
14.8% |
32 |
4.5% |
153 |
21.5% |
|
Topanga |
661 |
61.5% |
97 |
9.0% |
76 |
7.1% |
240 |
22.3% |
|
Lockhurst |
560 |
48.1% |
347 |
29.8% |
60 |
5.2% |
198 |
17.0% |
|
Glendale |
796 |
48.1% |
339 |
20.5% |
75 |
4.5% |
445 |
26.9% |
|
Locke |
864 |
77.8% |
51 |
4.6% |
35 |
3.2% |
161 |
14.5% |
|
Eagle Rock |
674 |
55.7% |
270 |
22.3% |
46 |
3.8% |
219 |
18.1% |
|
Lynwood |
1933 |
74.1% |
212 |
8.1% |
83 |
3.2% |
382 |
14.6% |
|
|
|
|
|
|
|
|
|
|
|
Total |
6928 |
61.49% |
1758 |
15.60% |
470 |
4.17% |
2111 |
18.74% |
By comparing the tables above, it is seen that Republican voters were undersampled in all 10 polling places, by ratios ranging from 1.16 to 1 at Taft High School to 2.5 to 1 at Topanga. In the ten polling places combined, the ratio is more than 3 to 2. This matters very much, because support for Propositions 4 and 8 was clearly correlated with party affiliation, and Proposition 8 was the more polarizing of the two.
A majority of Republicans supported both measures, but support was stronger for Proposition 8 (70.1%) than for Proposition 4 (63.1%). Majorities of Democrats, third-party voters, and unaffiliated voters opposed both propositions, and in all three cases, the opposition to Proposition 8 was stronger than to Proposition 4 (see Table 22).
TABLE 22: VOTE ON PROPOSITIONS 4 AND 8 BY PARTY AFFILIATION
|
|
Democrat |
Republican |
Other |
None |
||||
|
|
|
|
|
|
|
|
|
|
|
Yes on 4 |
1515 |
38.3% |
387 |
63.1% |
111 |
35.6% |
389 |
42.7% |
|
No on 4 |
2442 |
61.7% |
226 |
36.9% |
201 |
64.4% |
521 |
57.3% |
|
no vote |
217 |
|
33 |
|
19 |
|
265 |
|
|
|
|
|
|
|
|
|
|
|
|
Yes on 8 |
1417 |
35.1% |
440 |
70.1% |
93 |
29.5% |
410 |
41.2% |
|
No on 8 |
2625 |
64.9% |
188 |
29.9% |
222 |
70.5% |
585 |
58.8% |
|
no vote |
132 |
|
18 |
|
16 |
|
180 |
|
|
|
|
|
|
|
|
|
|
|
|
Total |
4174 |
100% |
646 |
100% |
331 |
100% |
1175 |
100% |
In the10 polling places combined, the response rate among Democrats was 60.2%, ranging from 44.2% at Glendale to 84.8% at Santa Monica, whereas the response rate among Republicans was only 36.7%, ranging from 21.6% at Topanga to 53.3% at Santa Monica (see Table 23). This underscores the importance of ascertaining the party affiliations of those who voted at the exit poll sites, in order to adjust the exit poll data accordingly; and it raises the challenge of how to encourage Republicans to participate in the exit polls.
TABLE 23: RESPONSE AND REFUSAL RATIOS BY PARTY AFFILIATION
|
|
Democratic |
Republican |
||||||||
|
|
Response |
Non-Response |
Total |
Response |
Non-Response |
Total |
||||
|
|
|
|
|
|
|
|
|
|
|
|
|
Taft |
170 |
65.6% |
89 |
34.4% |
259 |
79 |
50.0% |
79 |
50.0% |
158 |
|
Long Beach |
229 |
67.6% |
110 |
32.4% |
339 |
39 |
41.9% |
54 |
58.1% |
93 |
|
Berendo |
279 |
66.1% |
143 |
33.9% |
422 |
43 |
50.0% |
43 |
50.0% |
86 |
|
Santa Monica |
356 |
84.8% |
64 |
15.2% |
420 |
56 |
53.3% |
49 |
46.7% |
105 |
|
Topanga |
388 |
58.7% |
273 |
41.3% |
661 |
21 |
21.6% |
76 |
78.4% |
97 |
|
Lockhurst |
317 |
56.6% |
243 |
43.4% |
560 |
134 |
38.6% |
213 |
61.4% |
347 |
|
Glendale |
352 |
44.2% |
444 |
55.8% |
796 |
85 |
25.1% |
254 |
74.9% |
339 |
|
Locke |
587 |
67.9% |
277 |
32.1% |
864 |
16 |
31.4% |
35 |
68.6% |
51 |
|
Eagle Rock |
482 |
71.5% |
192 |
28.5% |
674 |
108 |
40.0% |
162 |
60.0% |
270 |
|
Lynwood |
1014 |
52.5% |
919 |
47.5% |
1933 |
65 |
30.7% |
147 |
69.3% |
212 |
|
|
|
|
|
|
|
|
|
|
|
|
|
Total |
4174 |
60.2% |
2754 |
39.8% |
6928 |
646 |
36.7% |
1112 |
63.3% |
1758 |
But when the exit poll data are adjusted according to party affiliation, only some, not all, of the disparity between the exit polls and the official results is accounted for. The result is an increase of 1.42% in the support for Proposition 4 and an increase of 2.01% in the support for Proposition 8. These adjustments in the exit poll data only make the official results more suspect, because the numbers for Proposition 4 are explained and the numbers for Proposition 8 are not. The disparity between the exit polls and the official results for Proposition 4 is reduced from 2.06% to 0.64%, well within the margin of error, whereas the disparity for Proposition 8, although reduced from 7.75% to 5.74%, is still enough to affect the margin by 11.48% (see Table 24).
TABLE 24: COMPARISON OF EXIT POLL DATA, ADJUSTED FOR PARTY AFFILIATION, AND OFFICIAL RESULTS FOR PROPOSITIONS 4 AND 8
|
|
Official |
LA% |
Exit Poll |
EP% |
Difference |
|
|
|
+3.68% |
|
-1.42% |
5.10% |
|
Ballots Cast |
11654 |
|
6326 |
|
|
|
Yes 4 |
4686 |
43.53% |
2483.7 |
42.89% |
0.64% |
|
No 4 |
6078 |
56.47% |
3306.9 |
57.11% |
|
|
Yes 8 |
5325 |
47.21% |
2480.3 |
41.47% |
5.74% |
|
No 8 |
5954 |
52.79% |
3500.7 |
58.53% |
When the exit poll data are adjusted according to party affiliation for each of the ten polling places individually, Proposition 4 runs more strongly in the official results than in the adjusted exit polls in 5 of 10 polling places, exactly half, which is what one would expect from a reliable exit poll, whereas Proposition 8 runs more strongly in the official results than in the adjusted exit polls in 9 of 10 polling places, almost all, which is what one would expect in a rigged election.
The disparities for Proposition 8 run as high as 3.8% at Lockhurst, 4.3% at Santa Monica, 4.7% at Topanga, 4.9% at Berendo, 6.1% at Lynwood, 6.3% at Eagle Rock, and 14.2% at Glendale. If election fraud is the reason for the disparities, one out of seven voters at Glendale had their votes on Proposition 8 reversed. Bear in mind that these disparities affect the margin of defeat or victory (the point spread) by twice these amounts. At Glendale, Proposition 8 was defeated in the adjusted exit poll by 22.0%, but carried the official count by 6.4% -- an astonishing difference of 28.4%. The calculations are set forth in full detail in the Appendix, and the adjusted numbers for each polling place for Propositions 4 and 8 are presented here (see Table 24).
Looked at another way, Proposition 8 was defeated in the Glendale exit poll by 392 (64.5%) to 216 (35.5%), but passed in the official results by 872 (53.2%) to 766 (46.8%). Among all non-responders, Proposition 8 must have passed overwhelmingly, by 656 (63.7%) to 374 (36.3%), or else the official results are not true and correct.
Among the exit poll responders, there were no demographic groups that supported Proposition 8 by such an overwhelming margin. Only among voters aged 60 or older did Proposition 8 receive even a majority – 26 (53%) to 23 (47%). Proposition 8 did enjoy overwhelming support among registered Republicans in Glendale, passing by 57 (68.7%) to 26 (31.3%), but at that ratio, it would take about 700 Republicans to bring the vote count for Proposition 8 up to 53.2%.
There appears to be no valid explanation for the official vote count for Proposition 8. We have properly adjusted the exit poll data to account for gender, age, race, and party affiliation, and a huge discrepancy remains. In the adjusted exit poll data, the opposition to Proposition 8 is still stronger than the opposition to Proposition 4, while the reverse relationship appears in the official results (see Table 25). I can only conclude that the official vote count for Proposition 8 may be fraudulent.
TABLE 25: COMPARISON OF ADJUSTED EXIT POLL DATA, ADJUSTED FOR PARTY AFFILIATION, AND OFFICIAL RESULTS FOR PROPOSITIONS 4 AND 8
|
Taft |
Official |
LA% |
Exit Poll |
EP% |
Difference |
|
|
|
+3.3% |
|
0.0% |
3.3% |
|
Ballots Cast |
569 |
|
310 |
|
|
|
Yes 4 |
180 |
33.7% |
102.8 |
36.0% |
-2.3% |
|
No 4 |
354 |
66.3% |
183.1 |
64.0% |
|
|
Yes 8 |
206 |
37.0% |
105.6 |
36.0% |
1.0% |
|
No 8 |
351 |
63.0% |
187.9 |
64.0% |
|
Long Beach |
Official |
LA% |
Exit Poll |
EP% |
Difference |
|
|
|
+9.4% |
|
-0.7% |
10.1% |
|
Ballots Cast |
603 |
|
353 |
|
|
|
Yes 4 |
291 |
53.7% |
198.1 |
62.1% |
-8.4% |
|
No 4 |
251 |
46.3% |
121.1 |
37.9% |
|
|
Yes 8 |
363 |
63.1% |
202.7 |
61.4% |
1.7% |
|
No 8 |
212 |
36.9% |
127.6 |
38.6% |
|
Berendo |
Official |
LA% |
Exit Poll |
EP% |
Difference |
|
|
|
+5.2% |
|
-1.2% |
6.4% |
|
Ballots Cast |
690 |
|
423 |
|
|
|
Yes 4 |
324 |
53.9% |
208.2 |
55.4% |
-1.5% |
|
No 4 |
277 |
46.1% |
167.6 |
44.6% |
|
|
Yes 8 |
390 |
59.1% |
208.0 |
54.2% |
4.9% |
|
No 8 |
270 |
40.9% |
176.0 |
45.8% |
|
Santa Monica |
Official |
LA% |
Exit Poll |
EP% |
Difference |
|
|
|
-1.2% |
|
-2.5% |
1.3% |
|
Ballots Cast |
762 |
|
534 |
|
|
|
Yes 4 |
135 |
19.0% |
76.0 |
16.0% |
3.0% |
|
No 4 |
575 |
81.0% |
399.0 |
84.0% |
|
|
Yes 8 |
132 |
17.8% |
68.1 |
13.5% |
4.3% |
|
No 8 |
610 |
82.2% |
437.6 |
86.5% |
|
Topanga |
Official |
LA% |
Exit Poll |
EP% |
Difference |
|
|
|
-0.3% |
|
-1.7% |
1.4% |
|
Ballots Cast |
1078 |
|
584 |
|
|
|
Yes 4 |
141 |
13.7% |
57.5 |
10.4% |
3.3% |
|
No 4 |
888 |
86.3% |
495.1 |
89.6% |
|
|
Yes 8 |
142 |
13.4% |
49.1 |
8.7% |
4.7% |
|
No 8 |
917 |
86.6% |
514.2 |
91.3% |
|
Lockhurst |
Official |
LA% |
Exit Poll |
EP% |
Difference |
|
|
|
+3.2% |
|
+1.3% |
1.9% |
|
Ballots Cast |
1186 |
|
597 |
|
|
|
Yes 4 |
431 |
38.8% |
208.0 |
36.9% |
1.9% |
|
No 4 |
679 |
61.2% |
355.3 |
63.1% |
|
|
Yes 8 |
487 |
42.0% |
220.2 |
38.2% |
3.8% |
|
No 8 |
672 |
58.0% |
356.6 |
61.8% |
|
Glendale |
Official |
LA% |
Exit Poll |
EP% |
Difference |
|
|
|
+3.6% |
|
-4.3% |
7.9% |
|
Ballots Cast |
1684 |
|
639 |
|
|
|
Yes 4 |
753 |
49.6% |
246.7 |
43.3% |
6.3% |
|
No 4 |
764 |
50.4% |
323.1 |
56.7% |
|
|
Yes 8 |
872 |
53.2% |
236.2 |
39.0% |
14.2% |
|
No 8 |
766 |
46.8% |
370.0 |
61.0% |
|
Locke |
Official |
LA% |
Exit Poll |
EP% |
Difference |
|
|
|
+9.7% |
|
+7.2% |
2.5% |
|
Ballots Cast |
1137 |
|
733 |
|
|
|
Yes 4 |
505 |
49.1% |
365.2 |
54.3% |
-5.2% |
|
No 4 |
523 |
50.9% |
307.1 |
45.7% |
|
|
Yes 8 |
632 |
58.8% |
424.5 |
61.5% |
-2.7% |
|
No 8 |
443 |
41.2% |
266.3 |
38.5% |
|
Eagle Rock |
Official |
LA% |
Exit Poll |
EP% |
Difference |
|
|
|
+2.8% |
|
-3.0% |
5.8% |
|
Ballots Cast |
1209 |
|
757 |
|
|
|
Yes 4 |
431 |
37.6% |
264.0 |
37.1% |
0.5% |
|
No 4 |
714 |
62.4% |
447.5 |
62.9% |
|
|
Yes 8 |
480 |
40.4% |
249.3 |
34.1% |
6.3% |
|
No 8 |
709 |
59.6% |
482.4 |
65.9% |
|
Lynwood |
Official |
LA% |
Exit Poll |
EP% |
Difference |
|
|
|
+3.1% |
|
-5.0% |
8.1% |
|
Ballots Cast |
2736 |
|
1396 |
|
|
|
Yes 4 |
1495 |
58.7% |
775.0 |
60.7% |
-2.0% |
|
No 4 |
1053 |
41.3% |
501.8 |
39.3% |
|
|
Yes 8 |
1621 |
61.8% |
729.4 |
55.7% |
6.1% |
|
No 8 |
1004 |
38.2% |
579.7 |
44.3% |
Conclusion
What we are seeing in the numbers from Los Angeles County represents a profound threat to self-governance and to personal autonomy. The most basic and fundamental right of the people in a democracy is the right to have our votes counted as cast. The most personal and private decision of one’s life is whether and whom to marry. In Los Angeles County, it appears that the one was violated in order to deny the other.
What this tells us yet again is that electronic vote counting cannot be trusted. Votes can be altered without leaving a trace, the citizens are none the wiser, and not even the election officials are certain of the count.
As long as electronic voting is used in our electoral process, it underscores the importance of exit polls -- not only as an instrument to analyze the voting patterns of the electorate, but more importantly, as a means to verify or challenge the accuracy of the official vote counts. It confirms the importance of careful analysis of exit poll results, with proper adjustments to account for sample bias with respect to gender, age, race, and party affiliation, showing all calculations as in a mathematics exam, because the raw exit poll data is never the whole story. And it heralds the monumental contribution of the 140 citizen volunteers who devoted their time, effort and energy to election protection in Los Angeles County. These people volunteered out of a love for their country and a distrust of electronic vote counting. Because we are unable to verify the security, accuracy and reliability of the computers themselves, exit polls may be our best available means to check the vote count.
The likelihood that the vote count in Los Angeles County was corrupted makes it incumbent upon Edison-Mitofsky to release the raw data for their exit polls. Their unadjusted data appears to have shown a statewide disparity of 4.2% for Proposition 8, strikingly similar to the citizen exit polls in Los Angeles County. Even if the raw, unadjusted data is normally considered proprietary, Edison-Mitofsky has a civic duty and a moral responsibility to release it, so that we can subject their data to the same scrutiny as our own data has undergone. We, the people, need to know if our votes have been counted accurately, or if the altered vote counts extend beyond Los Angeles County.
Sensitivity Analysis
Some have suggested that the reason for the disparity between the exit polls and the official results for Proposition 8 could be a sample bias among Republican voters. This theory assumes that the non-Republicans who responded to the exit poll were representative of the non-Republicans in the electorate, but that the Republican responders were more likely to have voted against Proposition 8 (that is, for gay marriage) than were the Republican refusals.
This theory derives from two established facts: in the 10 polling places combined, only 15.6% of the voters at the polls were registered Republicans and only 36.7% of them participated in the exit poll. It is entirely plausible that conservative Republicans would be more reluctant than moderate Republicans to participate in an exit poll being conducted in heavily Democratic precincts, in what Marj Creech and I have long called the “hostile territory scenario.”
Given the available data, the only way to test this scenario is to assume that non-Republican responders were representative of non-Republicans in the electorate and to stick to the data adjusted according to party affiliation; and to assume that all Republican non-responders, each and every one of them, voted for Proposition 8. This should reveal, once and for all, whether there were enough Republican non-responders to explain the official results, or whether it is mathematically impossible to do so.
In the 10 polling places combined, there were approximately 1172 Republican non-responders, accounting for 10.1% of the electorate. Among the Republican responders who indicated a choice on Proposition 8, 70.1% voted for it, and this was the percentage used when adjusting the exit poll data to account for party affiliation.
Thus, even if each and every Republican non-responder voted for Proposition 8, it could only account for 3% of the electorate (30% of 10%), and cannot explain the disparity between the adjusted exit poll data and the official results.
Looked at another way, 35.9% of non-Republican exit poll responders voted for Proposition 8; at that rate, about 1492 non-Republican non-responders would have voted for Proposition 8 (in addition to 2360 exit poll responders, including Republicans, who voted for it). This still leaves us 1473 votes short of the official count for Proposition 8 (5325 minus 3852), and there were only about 1172 Republican non-responders.
Thus, even if each and every Republican non-responder voted for Proposition 8, it is not enough to explain the official results (see Table 26).
The best example is at Glendale, where 24.9% of non-responders, about 260 of 1045, were Republicans. Even if they all voted “Yes” on Proposition 8, the official results cannot be explained unless 396 of 785 other non-responders, more than half, also voted “Yes” on Proposition 8. But among exit poll responders at Glendale, Proposition 8 was supported by only 26.0% of Democrats, 26.8% of third-party voters, and 42.0% of unaffiliated voters, as shown in the Appendix. Even among Republicans, only 68.6% supported Proposition 8 – a solid majority, but not 100%. Thus, the official results are mathematically impossible to explain unless one assumes that all samples of voters, of all parties, were non-representative.
When one analyzes Proposition 4 in the same manner, a very different story emerges. In the 10 polling places combined, 38.9% of non-Republican exit poll responders voted for Proposition 4; at that rate, about 1617 non-Republican non-responders would have voted for Proposition 4 (in addition to the 2402 exit poll responders, including Republicans, who voted for it). This leaves us only 667 votes short of the official count for Proposition 4 (4686 minus 4019), and there were about 1172 Republican non-responders; if only 56.9% of these voted for Proposition 4, the official results can be explained. (See Table 27
The interpretation that the disparity between the exit poll data and the official results for Proposition 8 is due to a corrupted vote count is bolstered by the fact that the official results for Proposition 4 are so easily explained by data from the very same exit poll – the same voters, the same day. The official results for Proposition 8 may very well be fraudulent.
The interpretation that the official results for Proposition 8 are true and correct not only requires that Republican exit poll responders were very different from Republican non-responders, but that Democratic, third-party, and unaffiliated exit poll responders were likewise non-representative of the electorate.
This argument would render useless and invalid any exit poll conducted anywhere – in Ukraine, Georgia, Iran, Iraq, Mexico, Ohio or California – because it would allow the results of any exit poll to be dismissed on the unwarranted assumptions that the official results are true and correct, that the exit poll responders must not be representative of the electorate, and that the exit poll results must therefore be wrong. But exit polls have a long history of being remarkably accurate reflections of the electorate. In Germany and elsewhere, exit polls are relied upon to forecast the winners of the elections, and citizens are content to wait for days to hear the official count.
TABLE 26: DATA FOR REPUBLICAN AND NON-REPUBLICAN
RESPONDERS AND NON-RESPONDERS, PROPOSITION 8
|
|
Ballots Cast |
Republicans |
Others |
|
|
|
|
|
|
Official Results |
11654 |
~ 1818 |
~ 9836 |
|
Official % |
|
15.6% |
84.4% |
|
Exit Poll |
6326 |
646 |
5680 |
|
Exit Poll % |
|
10.2% |
89.8% |
|
Non-Responders |
5328 |
~ 1172 |
~ 4156 |
|
% of Electorate |
|
10.1% |
35.7% |
|
Yes 8 (Official) |
5325 |
|
|
|
Official % |
47.2% |
|
|
|
Yes 8 (Exit Poll) |
2360 |
440 |
1920 |
|
Exit Poll % |
39.5% |
70.1% |
35.9% |
|
No 8 (Official) |
5954 |
|
|
|
Official % |
52.8% |
|
|
|
No 8 (Exit Poll) |
3620 |
188 |
3432 |
|
Exit Poll % |
60.5% |
29.9% |
64.1% |
|
No Vote (Exit Poll) |
346 |
18 |
328 |
TABLE 27: DATA FOR REPUBLICAN AND NON-REPUBLICAN
RESPONDERS AND NON-RESPONDERS, PROPOSITION 4
|
|
Ballots Cast |
Republicans |
Others |
|
|
|
|
|
|
Yes 4 (Official) |
4686 |
|
|
|
Official % |
43.5% |
|
|
|
Yes 4 (Exit Poll) |
2402 |
387 |
2015 |
|
Exit Poll % |
41.5% |
63.1% |
38.9% |
|
No 4 (Official) |
6078 |
|
|
|
Official % |
56.5% |
|
|
|
No 4 (Exit Poll) |
3390 |
226 |
3164 |
|
Exit Poll % |
55.5% |
36.9% |
61.1% |
|
No Vote (Exit Poll) |
534 |
33 |
501 |
____________________________________________________
| Attachment | Size |
|---|---|
| CA-Prop8-Exit-Polls-LA-County-RHP.pdf [8] | 419.22 KB |
|
|
Official Results
|
Exit Poll
|
||
|
|
McCain
|
Obama
|
McCain
|
Obama
|
|
|
|
|
|
|
|
CA LA Taft 9001037A
|
201 36.0%
|
346 61.9%
|
88 28.7%
|
214 69.7%
|
|
CA LA Long Beach 3850101A
|
120 20.3%
|
459 77.8%
|
55 15.8%
|
285 81.9%
|
|
CA LA Berendo 9005399A
|
127 18.9%
|
527 78.4%
|
72 17.5%
|
331 80.5%
|
|
CA LA Santa Monica 6250005A
|
128 17.0%
|
614 81.5%
|
56 10.6%
|
465 87.7%
|
|
CA LA Topanga 710003A 6A
|
129 12.0%
|
918 85.3%
|
26 4.5%
|
535 93.5%
|
|
CA LA Lockhurst 9006489A 90A
|
405 34.8%
|
743 63.8%
|
151 25.8%
|
421 72.0%
|
|
CA LA Glendale 2550120A 120B 122A
|
393 23.9%
|
1218 74.0%
|
106 16.7%
|
511 80.7%
|
|
CA LA Locke 9001145A 9002566A
|
47 4.2%
|
1050 94.4%
|
24 3.3%
|
698 96.1%
|
|
CA LA Eagle Rock 9006334A 6335A
|
347 28.9%
|
827 68.9%
|
157 21.0%
|
575 76.8%
|
|
CA LA Lynwood 3990015A 16A 18A 19A
|
253 9.3%
|
2421 89.4%
|
106 7.7%
|
1263 91.7%
|
|
CA Alameda 280300 280700
|
95 17.6%
|
428 79.1%
|
43 13.0%
|
286 86.1%
|
|
MI Oakland West Bloomfield 2
|
433 43.5%
|
545 54.7%
|
134 33.7%
|
257 64.6%
|
|
MI Washtenaw Chelsea 1 2
|
752 39.6%
|
1115 58.7%
|
195 27.0%
|
509 70.5%
|
|
NH Hillsborough Manchester 3
|
1013 33.2%
|
2003 65.7%
|
401 26.1%
|
1106 72.0%
|
|
NH Hillsborough Manchester 5
|
992 35.6%
|
1761 63.2%
|
286 25.0%
|
832 72.8%
|
|
NH Hillsborough Nashua 5
|
2499 47.2%
|
2741 51.8%
|
746 41.4%
|
1022 56.7%
|
|
NH Hillsborough Wilton
|
1026 44.6%
|
1248 54.3%
|
416 36.7%
|
692 61.1%
|
|
NM Santa Fe 7 Rio En Medio
|
27 14.1%
|
161 83.9%
|
19 13.3%
|
120 83.9%
|
|
NM Santa Fe 25 33 Alameda
|
91 21.0%
|
332 76.7%
|
51 15.6%
|
267 81.7%
|
|
NM Taos Pueblo 13
|
13 4.3%
|
291 95.7%
|
8 3.4%
|
224 96.6%
|
|
OH Cuyahoga Beachwood A B N
|
542 40.6%
|
784 58.7%
|
229 40.5%
|
331 58.5%
|
|
OH Cuyahoga Independence A C F
|
1013 57.7%
|
717 40.8%
|
307 53.5%
|
254 44.3%
|
|
OH Cuyahoga Rocky River 1D 1E 1G
|
676 53.4%
|
571 45.1%
|
223 46.8%
|
246 51.7%
|
|
PA Allegheny Pittsburgh W 14 D 8
|
107 21.1%
|
394 78.0%
|
45 14.4%
|
264 84.3%
|
|
PA Cambria Munster
|
239 71.6%
|
89 26.6%
|
189 71.3%
|
67 25.3%
|
|
PA Centre Harris Twp 56 57
|
1379 46.7%
|
1540 52.1%
|
490 37.1%
|
816 61.8%
|
|
PA Philadelphia D 30 W 5 10
|
21 3.8%
|
535 95.9%
|
8 1.8%
|
440 97.8%
|
|
TX Harris Houston 34
|
197 27.9%
|
483 68.3%
|
95 20.3%
|
355 75.7%
|
|
|
Exit Poll Responders
|
Non-Responders
|
||
|
|
McCain
|
Obama
|
McCain
|
Obama
|
|
|
|
|
|
|
|
CA LA Taft 9001037A
|
88 28.7%
|
214 69.7%
|
113 44.8%
|
132 52.4%
|
|
CA LA Long Beach 3850101A
|
55 15.8%
|
285 81.9%
|
65 26.9%
|
174 71.9%
|
|
CA LA Santa Monica 6250005A
|
56 10.6%
|
465 87.7%
|
72 32.3%
|
149 66.8%
|
|
CA LA Topanga 710003A 6A
|
26 4.5%
|
535 93.5%
|
103 20.4%
|
383 76.0%
|
|
CA LA Lockhurst 9006489A 90A
|
151 25.8%
|
421 72.0%
|
254 43.9%
|
322 55.6%
|
|
CA LA Glendale 2550120A 120B 122A
|
106 16.7%
|
511 80.7%
|
287 28.3%
|
707 69.7%
|
|
CA LA Eagle Rock 9006334A 6335A
|
157 21.0%
|
575 76.8%
|
190 42.0%
|
252 55.8%
|
|
CA Alameda 280300 280700
|
43 12.9%
|
286 85.6%
|
52 25.1%
|
142 68.6%
|
|
MI Oakland West Bloomfield 2
|
134 33.7%
|
257 64.6%
|
299 50.1%
|
288 48.2%
|
|
MI Washtenaw Chelsea 1 2
|
195 27.0%
|
509 70.5%
|
557 47.4%
|
606 51.5%
|
|
NH Hillsborough Manchester 3
|
401 26.1%
|
1106 72.0%
|
612 40.4%
|
897 59.3%
|
|
NH Hillsborough Manchester 5
|
286 25.0%
|
832 72.8%
|
706 43.0%
|
929 56.6%
|
|
NH Hillsborough Nashua 5
|
746 41.4%
|
1022 56.7%
|
1753 50.3%
|
1719 49.3%
|
|
NH Hillsborough Wilton
|
416 36.7%
|
692 61.1%
|
610 52.3%
|
556 47.7%
|
|
NM Santa Fe 25 33 Alameda
|
51 15.6%
|
267 81.7%
|
40 37.7%
|
65 61.3%
|
|
OH Cuyahoga Independence A C F
|
307 53.5%
|
254 44.3%
|
706 59.7%
|
463 39.1%
|
|
OH Cuyahoga Rocky River 1D 1E 1G
|
223 46.8%
|
246 51.7%
|
453 57.4%
|
325 41.2%
|
|
PA Allegheny Pittsburgh W 14 D 8
|
45 14.4%
|
264 84.3%
|
62 32.3%
|
130 67.7%
|
|
PA Centre Harris Twp 56 57
|
490 37.1%
|
816 61.8%
|
889 54.4%
|
724 44.3%
|
|
TX Harris Houston 34
|
95 20.3%
|
355 75.7%
|
102 42.5%
|
128 53.3%
|
|
|
Exit Poll Responders
|
Voters at Polls
|
||||||
|
|
Rep.
|
Dem.
|
Other
|
None
|
Rep.
|
Dem.
|
Other
|
None
|
|
|
|
|
|
|
|
|
|
|
|
CA LA Taft
|
25.5%
|
54.8%
|
3.9%
|
15.8%
|
29.6%
|
48.6%
|
3.2%
|
18.6%
|
|
CA LA Long Beach
|
11.0%
|
64.9%
|
5.4%
|
18.7%
|
16.7%
|
60.8%
|
4.5%
|
18.1%
|
|
CA LA Berendo
|
10.2%
|
66.0%
|
2.8%
|
21.0%
|
13.4%
|
65.7%
|
3.3%
|
17.6%
|
|
CA LA Santa Monica
|
10.5%
|
66.7%
|
5.1%
|
17.8%
|
14.8%
|
59.2%
|
4.5%
|
21.5%
|
|
CA LA Topanga
|
3.6%
|
66.4%
|
10.4%
|
19.5%
|
9.0%
|
61.5%
|
7.1%
|
22.3%
|
|
CA LA Lockhurst
|
22.4%
|
53.1%
|
8.5%
|
15.9%
|
29.8%
|
48.1%
|
5.2%
|
17.0%
|
|
CA LA Glendale
|
13.3%
|
55.1%
|
6.6%
|
25.0%
|
20.5%
|
48.1%
|
4.5%
|
26.9%
|
|
CA LA Locke
|
2.2%
|
80.1%
|
2.7%
|
15.0%
|
4.6%
|
77.8%
|
3.2%
|
14.5%
|
|
CA LA Eagle Rock
|
14.3%
|
63.7%
|
5.8%
|
16.2%
|
22.3%
|
55.7%
|
3.8%
|
18.1%
|
|
CA LA Lynwood
|
4.7%
|
72.6%
|
3.1%
|
19.6%
|
8.1%
|
74.1%
|
3.2%
|
14.6%
|
|
NH Manchester 3
|
18.4%
|
42.9%
|
38.7%
|
21.9%
|
41.6%
|
36.5%
|
||
|
NH Manchester 5
|
17.5%
|
48.6%
|
33.9%
|
20.7%
|
46.0%
|
33.3%
|
||
|
NH Nashua 5
|
25.4%
|
35.6%
|
39.0%
|
27.2%
|
30.4%
|
42.4%
|
||
|
NH Wilton
|
25.0%
|
36.6%
|
38.4%
|
29.9%
|
31.2%
|
38.9%
|
||
|
PA Pittsburgh
|
10.1%
|
75.3%
|
14.6%
|
12.8%
|
73.5%
|
13.7%
|
||
|
PA Cambria Munster
|
42.8%
|
47.2%
|
10.0%
|
40.4%
|
52.7%
|
6.9%
|
||
|
PA Centre Harris Twp
|
39.5%
|
49.9%
|
10.6%
|
47.7%
|
40.7%
|
11.6%
|
||
|
PA Philadelphia
|
3.5%
|
80.2%
|
16.4%
|
6.7%
|
82.4%
|
10.9%
|
||
|
|
Official Results
|
Adjusted Exit Poll Data
|
||
|
|
McCain
|
Obama
|
McCain
|
Obama
|
|
|
|
|
|
|
|
CA LA Taft 9001037A
|
201 36.0%
|
346 61.9%
|
97.6 31.8%
|
204.3 66.5%
|
|
CA LA Long Beach 3850101A
|
120 20.3%
|
459 77.8%
|
71.2 20.4%
|
269.6 77.4%
|
|
CA LA Berendo 9005399A
|
127 18.9%
|
527 78.4%
|
78.5 19.1%
|
325.3 79.0%
|
|
CA LA Santa Monica 6250005A
|
128 17.0%
|
614 81.5%
|
72.6 13.7%
|
445.9 84.3%
|
|
CA LA Topanga 710003A 6A
|
129 12.0%
|
918 85.3%
|
42.0 7.3%
|
521.3 91.1%
|
|
CA LA Lockhurst 9006489A 90A
|
405 34.8%
|
743 63.8%
|
175.2 30.0%
|
395.7 67.7%
|
|
CA LA Glendale 2550120A 120B 122A
|
393 23.9%
|
1218 74.0%
|
136.7 21.6%
|
478.2 75.7%
|
|
CA LA Locke 9001145A 9002566A
|
47 4.2%
|
1050 94.4%
|
31.3 4.3%
|
690.1 95.1%
|
|
CA LA Eagle Rock 9006334A 6335A
|
347 28.9%
|
827 68.9%
|
204.6 27.4%
|
524.4 70.2%
|
|
CA LA Lynwood 3990015A 16A 18A 19A
|
253 9.3%
|
2421 89.4%
|
138.3 10.0%
|
1229.6 89.2%
|
|
NH Hillsborough Manchester 3
|
1013 33.2%
|
2003 65.7%
|
437.1 28.4%
|
1070.6 69.7%
|
|
NH Hillsborough Manchester 5
|
992 35.6%
|
1761 63.2%
|
312.1 27.3%
|
805.1 70.5%
|
|
NH Hillsborough Nashua 5
|
2499 47.2%
|
2741 51.8%
|
790.5 43.7%
|
982.4 54.3%
|
|
NH Hillsborough Wilton
|
1026 44.6%
|
1248 54.3%
|
461.3 40.7%
|
647.1 57.1%
|
|
PA Allegheny Pittsburgh W 14 D 8
|
107 21.1%
|
394 78.0%
|
51.1 16.3%
|
258.1 82.4%
|
|
PA Cambria Munster
|
239 71.6%
|
89 26.6%
|
185.6 69.9%
|
70.9 26.7%
|
|
PA Centre Harris Twp 56 57
|
1379 46.7%
|
1540 52.1%
|
570.0 43.2%
|
732.7 55.6%
|
|
PA Philadelphia D 30 W 5 10
|
21 3.8%
|
535 95.9%
|
13.2 2.9%
|
434.4 96.5%
|
|
Total Registered Voters
|
Rep.
|
Dem.
|
Ind.
|
|
|
|
|
|
|
OH Cuyahoga Beachwood A B N
|
137 7.0%
|
934 47.8%
|
882 45.2%
|
|
OH Cuyahoga Independence A C F
|
462 19.0%
|
1013 41.7%
|
954 39.3%
|
|
OH Cuyahoga Rocky River 1D 1E 1G
|
488 27.1%
|
624 34.6%
|
689 38.3%
|
|
Exit Poll Responders
|
Rep.
|
Dem.
|
Ind.
|
|
|
|
|
|
|
OH Cuyahoga Beachwood A B N
|
91 15.8%
|
317 55.0%
|
168 29.2%
|
|
OH Cuyahoga Independence A C F
|
186 32.1%
|
261 45.1%
|
132 22.8%
|
|
OH Cuyahoga Rocky River 1D 1E 1G
|
190 39.4%
|
196 40.7%
|
96 19.9%
|
|
Total Registered Voters
|
Rep.
|
Dem.
|
Other / None
|
|
|
|
|
|
|
NM Santa Fe 7 Rio En Medio
|
79 13.6%
|
365 63.0%
|
135 23.3%
|
|
NM Santa Fe 25 33 Alameda
|
141 7.1%
|
1384 69.9%
|
456 23.0%
|
|
NM Taos Pueblo 13
|
43 5.6%
|
578 74.8%
|
152 19.7%
|
|
Exit Poll Responders
|
Rep.
|
Dem.
|
Other / None
|
|
|
|
|
|
|
NM Santa Fe 7 Rio En Medio
|
25 16.9%
|
101 68.2%
|
22 14.9%
|
|
NM Santa Fe 25 33 Alameda
|
37 11.0%
|
253 75.5%
|
45 13.4%
|
|
NM Taos Pueblo 13
|
13 5.6%
|
196 84.1%
|
24 10.3%
|
|
|
Official Results U.S. Congress
|
Exit Poll U.S. Congress
|
||
|
|
Republican *
|
Democratic
|
Republican *
|
Democratic
|
|
|
|
|
|
|
|
CA LA Long Beach 3850101A *
|
104 19.2%
|
439 80.8%
|
55 17.7%
|
255 82.3%
|
|
CA LA Glendale 2550120A 120B 122A
|
295 20.1%
|
1079 73.5%
|
74 13.9%
|
435 81.5%
|
|
CA LA Locke 9001145A 9002566A *
|
93 10.7%
|
775 89.3%
|
59 8.9%
|
602 91.1%
|
|
CA LA Lynwood 3990015A 16A 18A 19A
|
256 10.2%
|
2264 89.8%
|
103 8.1%
|
1170 91.9%
|
|
CA Alameda 280300 280700
|
128 25.0%
|
355 69.5%
|
56 19.2%
|
225 77.1%
|
|
MI Oakland West Bloomfield 2
|
440 45.4%
|
466 48.1%
|
143 40.6%
|
191 54.3%
|
|
MI Washtenaw Chelsea 1 2
|
745 40.6%
|
993 54.1%
|
186 28.3%
|
437 66.5%
|
|
NH Hillsborough Manchester 3
|
996 34.5%
|
1809 62.7%
|
432 29.3%
|
972 65.9%
|
|
NH Hillsborough Manchester 5
|
925 34.9%
|
1632 61.6%
|
294 27.0%
|
745 68.3%
|
|
NH Hillsborough Nashua 5
|
2239 45.3%
|
2580 52.2%
|
667 39.7%
|
943 56.1%
|
|
NH Hillsborough Wilton
|
931 42.8%
|
1203 55.3%
|
371 35.5%
|
651 62.2%
|
|
NM Santa Fe 7 Rio En Medio
|
20 10.5%
|
128 67.4%
|
10 7.5%
|
99 74.4%
|
|
NM Santa Fe 25 33 Alameda
|
50 11.7%
|
308 72.1%
|
33 10.4%
|
251 78.9%
|
|
NM Taos Pueblo 13
|
8 2.7%
|
267 88.7%
|
4 1.9%
|
195 90.3%
|
|
OH Cuyahoga Beachwood A B N
|
345 30.6%
|
777 69.0%
|
123 28.0%
|
304 69.1%
|
|
OH Cuyahoga Independence A C F
|
1025 60.9%
|
622 36.9%
|
300 56.1%
|
224 41.9%
|
|
OH Cuyahoga Rocky River 1D 1E 1G
|
719 59.0%
|
477 39.1%
|
249 54.1%
|
196 42.6%
|
|
PA Allegheny Pittsburgh W 14 D 8 *
|
54 11.7%
|
403 87.2%
|
27 9.5%
|
253 89.0%
|
|
PA Cambria Munster
|
193 58.3%
|
138 41.7%
|
155 59.6%
|
105 40.4%
|
|
PA Centre Harris Twp 56 57
|
1616 55.6%
|
1229 42.3%
|
577 45.0%
|
684 53.3%
|
|
PA Philadelphia D 30 W 5 10
|
44 8.8%
|
457 91.2%
|
31 8.1%
|
351 91.6%
|
|
TX Harris Houston 34
|
386 21.8%
|
1345 75.8%
|
72 15.7%
|
380 82.8%
|
|
|
Official Results
|
Exit Poll
|
Disparity
|
|||
|
|
President
|
Congress
|
President
|
Congress
|
President
|
Congress
|
|
|
|
|
|
|
|
|
|
CA LA Long Beach 101A
|
57.5%
|
61.6%
|
66.1%
|
64.6%
|
8.6%
|
3.0%
|
|
CA LA Glendale 120A 120B 122A
|
50.1%
|
53.4%
|
64.0%
|
67.6%
|
13.9%
|
14.2%
|
|
CA LA Locke 1145A 2566A
|
90.2%
|
78.6%
|
92.8%
|
82.2%
|
2.6%
|
3.6%
|
|
CA LA Lynwood 15A 16A 18A 19A
|
80.1%
|
79.6%
|
84.0%
|
83.8%
|
3.9%
|
4.2%
|
|
CA Alameda 280300 280700
|
61.5%
|
44.5%
|
73.1%
|
57.9%
|
11.6%
|
13.4%
|
|
MI Oakland West Bloomfield 2
|
11.2%
|
2.7%
|
30.9%
|
13.7%
|
19.7%
|
11.0%
|
|
MI Washtenaw Chelsea 1 2
|
19.1%
|
13.5%
|
43.5%
|
38.2%
|
24.4%
|
24.7%
|
|
NH Hillsborough Manchester 3
|
32.5%
|
28.2%
|
45.9%
|
36.6%
|
13.4%
|
8.4%
|
|
NH Hillsborough Manchester 5
|
27.6%
|
26.7%
|
47.8%
|
41.3%
|
20.2%
|
14.6%
|
|
NH Hillsborough Nashua 5
|
4.6%
|
6.9%
|
15.3%
|
16.4%
|
10.7%
|
9.5%
|
|
NH Hillsborough Wilton
|
9.7%
|
12.5%
|
24.4%
|
26.7%
|
14.7%
|
14.2%
|
|
NM Santa Fe 7 Rio En Medio
|
69.8%
|
56.9%
|
70.6%
|
66.9%
|
0.8%
|
10.0%
|
|
NM Santa Fe 25 33 Alameda
|
55.7%
|
60.4%
|
66.1%
|
68.5%
|
10.4%
|
7.9%
|
|
NM Taos Pueblo 13
|
91.4%
|
86.0%
|
93.2%
|
88.4%
|
1.8%
|
2.4%
|
|
OH Cuyahoga Beachwood A B N
|
18.1%
|
38.4%
|
18.0%
|
41.1%
|
-0.1%
|
2.7%
|
|
OH Cuyahoga Independence A C F
|
-16.9%
|
-24.0%
|
-9.2%
|
-14.2%
|
7.7%
|
9.8%
|
|
OH Cuyahoga Rocky River 1D 1E 1G
|
-8.3%
|
-19.9%
|
4.9%
|
-11.5%
|
13.2%
|
8.4%
|
|
PA Allegheny Pittsburgh W 14 D 8
|
56.9%
|
75.5%
|
69.9%
|
79.5%
|
13.0%
|
4.0%
|
|
PA Cambria Munster
|
-45.0%
|
-16.6%
|
-46.0%
|
-19.2%
|
-1.0%
|
-2.6%
|
|
PA Centre Harris Twp 56 57
|
5.4%
|
-13.3%
|
24.7%
|
8.3%
|
19.3%
|
21.6%
|
|
PA Philadelphia D 30 W 5 10
|
92.1%
|
82.4%
|
96.0%
|
83.5%
|
3.9%
|
1.1%
|
|
TX Harris Houston 34
|
40.4%
|
54.0%
|
55.4%
|
67.1%
|
15.0%
|
13.1%
|
|
|
Exit Poll Responders
|
Non-Responders
|
||
|
|
Republican *
|
Democratic
|
Republican *
|
Democratic
|
|
|
|
|
|
|
|
CA LA Long Beach 101A *
|
55 17.7%
|
255 82.3%
|
49 21.0%
|
184 79.0%
|
|
CA LA Glendale 120A 120B 122A
|
74 13.9%
|
435 81.5%
|
221 23.7%
|
644 68.9%
|
|
CA LA Locke 1145A 2566A *
|
59 8.9%
|
602 91.1%
|
34 16.4%
|
173 83.6%
|
|
CA LA Lynwood 15A 16A 18A 19A
|
103 8.1%
|
1170 91.9%
|
153 12.3%
|
1094 87.7%
|
|
CA Alameda 280300 280700
|
56 19.2%
|
225 77.1%
|
72 32.9%
|
130 59.4%
|
|
MI Oakland West Bloomfield 2
|
143 40.6%
|
191 54.3%
|
297 51.3%
|
275 47.5%
|
|
MI Washtenaw Chelsea 1 2
|
186 28.3%
|
437 66.5%
|
559 50.1%
|
556 49.9%
|
|
NH Hillsborough Manchester 3
|
432 29.3%
|
972 65.9%
|
564 40.0%
|
837 59.4%
|
|
NH Hillsborough Manchester 5
|
294 27.0%
|
745 68.3%
|
631 40.4%
|
887 56.8%
|
|
NH Hillsborough Nashua 5
|
667 39.7%
|
943 56.1%
|
1572 48.1%
|
1637 50.1%
|
|
NH Hillsborough Wilton
|
371 35.5%
|
651 62.2%
|
560 49.6%
|
552 48.9%
|
|
NM Santa Fe 7 Rio En Medio
|
10 7.5%
|
99 77.4%
|
10 17.5%
|
29 50.9%
|
|
NM Santa Fe 25 33 Alameda
|
33 10.4%
|
251 78.9%
|
17 15.6%
|
57 52.3%
|
|
NM Taos Pueblo 13
|
4 1.9%
|
195 90.3%
|
4 4.7%
|
72 84.7%
|
|
OH Cuyahoga Beachwood A B N
|
123 28.0%
|
304 69.1%
|
222 31.9%
|
473 68.1%
|
|
OH Cuyahoga Independence A C F
|
300 56.1%
|
224 41.9%
|
725 63.1%
|
398 34.6%
|
|
OH Cuyahoga Rocky River 1D 1E 1G
|
249 54.1%
|
196 42.6%
|
470 61.9%
|
281 37.0%
|
|
PA Allegheny Pittsburgh W 14 D 8 *
|
27 9.5%
|
253 89.0%
|
27 15.2%
|
150 84.3%
|
|
PA Cambria Munster
|
155 59.6%
|
105 40.4%
|
38 53.5%
|
33 46.5%
|
|
PA Centre Harris Twp 56 57
|
577 45.0%
|
684 53.3%
|
1039 64.1%
|
545 33.6%
|
|
PA Philadelphia D 30 W 5 10
|
31 8.1%
|
351 91.6%
|
13 10.9%
|
106 89.1%
|
|
TX Harris Houston 34
|
72 15.7%
|
380 82.3%
|
314 23.9%
|
965 73.4%
|
|
|
Official Results U.S. Congress
|
Adjusted Exit Poll Data
|
||
|
|
Republican *
|
Democratic
|
Republican *
|
Democratic
|
|
|
|
|
|
|
|
CA LA Long Beach 3850101A *
|
104 19.2%
|
439 80.8%
|
63.5 20.5%
|
246.2 79.5%
|
|
CA LA Glendale 2550120A 120B 122A
|
295 20.1%
|
1079 73.5%
|
95.2 18.0%
|
407.5 77.0%
|
|
CA LA Locke 9001145A 9002566A *
|
93 10.7%
|
775 89.3%
|
63.5 9.6%
|
598.6 90.4%
|
|
CA LA Lynwood 3990015A 16A 18A 19A
|
256 10.2%
|
2264 89.8%
|
126.7 9.9%
|
1154.7 90.1%
|
|
NH Hillsborough Manchester 3
|
996 34.5%
|
1809 62.7%
|
463.9 31.4%
|
943.7 63.8%
|
|
NH Hillsborough Manchester 5
|
925 34.9%
|
1632 61.6%
|
317.8 29.1%
|
722.1 66.2%
|
|
NH Hillsborough Nashua 5
|
2239 45.3%
|
2580 52.2%
|
704.8 41.9%
|
906.8 53.9%
|
|
NH Hillsborough Wilton
|
931 42.8%
|
1203 55.3%
|
408.7 39.2%
|
610.7 58.6%
|
|
PA Allegheny Pittsburgh W 14 D 8 *
|
54 11.7%
|
403 87.2%
|
27.7 9.8%
|
250.8 88.5%
|
|
PA Cambria Munster
|
193 58.3%
|
138 41.7%
|
153.9 57.2%
|
107.2 39.9%
|
|
PA Centre Harris Twp 56 57
|
1616 55.6%
|
1229 42.3%
|
660.4 51.4%
|
603.1 47.0%
|
|
PA Philadelphia D 30 W 5 10
|
44 8.8%
|
457 91.2%
|
36.4 9.3%
|
354.6 90.5%
|
|
|
Official Results U.S. Senate
|
Exit Poll U.S. Senate
|
||
|
|
Republican
|
Democratic
|
Republican
|
Democratic
|
|
|
|
|
|
|
|
MI Oakland West Bloomfield 2
|
338 35.0%
|
573 59.4%
|
107 28.9%
|
244 65.9%
|
|
MI Washtenaw Chelsea 1 2
|
629 34.0%
|
1152 62.2%
|
152 23.3%
|
468 71.7%
|
|
NH Hillsborough Manchester 3
|
1078 36.3%
|
1794 60.4%
|
484 31.7%
|
975 63.8%
|
|
NH Hillsborough Manchester 5
|
993 36.1%
|
1650 60.0%
|
315 27.7%
|
762 67.1%
|
|
NH Hillsborough Nashua 5
|
2337 45.2%
|
2639 51.0%
|
722 40.4%
|
983 55.0%
|
|
NH Hillsborough Wilton
|
1010 45.2%
|
1148 51.4%
|
401 36.6%
|
650 59.4%
|
|
NM Santa Fe 7 Rio En Medio
|
28 14.7%
|
163 85.3%
|
19 13.1%
|
125 86.2%
|
|
NM Santa Fe 25 33 Alameda
|
76 17.6%
|
357 82.4%
|
44 13.5%
|
279 85.8%
|
|
NM Taos Pueblo 13
|
12 4.0%
|
290 96.0%
|
10 4.4%
|
217 95.2%
|
|
TX Harris Houston 34
|
426 23.9%
|
1296 72.8%
|
94 20.3%
|
360 77.9%
|
|
|
Official Results
|
Exit Poll
|
Disparity
|
|||
|
|
President
|
Senate
|
President
|
Senate
|
President
|
Senate
|
|
|
|
|
|
|
|
|
|
MI Oakland West Bloomfield 2
|
11.2%
|
24.4%
|
30.9%
|
37.0%
|
19.7%
|
12.6%
|
|
MI Washtenaw Chelsea 1 2
|
19.1%
|
28.2%
|
43.5%
|
48.4%
|
24.4%
|
20.2%
|
|
NH Hillsborough Manchester 3
|
32.5%
|
24.1%
|
45.9%
|
32.1%
|
13.4%
|
8.0%
|
|
NH Hillsborough Manchester 5
|
27.6%
|
23.9%
|
47.8%
|
39.4%
|
20.2%
|
15.5%
|
|
NH Hillsborough Nashua 5
|
4.6%
|
5.8%
|
15.3%
|
14.6%
|
10.7%
|
8.8%
|
|
NH Hillsborough Wilton
|
9.7%
|
6.2%
|
24.4%
|
22.8%
|
14.7%
|
16.6%
|
|
NM Santa Fe 7 Rio En Medio
|
69.8%
|
70.6%
|
70.6%
|
73.1%
|
0.8%
|
2.5%
|
|
NM Santa Fe 25 33 Alameda
|
55.7%
|
64.8%
|
66.1%
|
72.3%
|
10.4%
|
7.7%
|
|
NM Taos Pueblo 13
|
91.4%
|
92.0%
|
93.2%
|
90.8%
|
1.8%
|
- 1.2%
|
|
TX Harris Houston 34
|
40.4%
|
48.9%
|
55.4%
|
57.6%
|
15.0%
|
12.2%
|
|
|
Exit Poll Responders
|
Non-Responders
|
||
|
|
Republican
|
Democratic
|
Republican
|
Democratic
|
|
|
|
|
|
|
|
MI Oakland West Bloomfield 2
|
107 28.9%
|
244 65.9%
|
231 38.8%
|
329 55.3%
|
|
MI Washtenaw Chelsea 1 2
|
152 23.3%
|
468 71.7%
|
477 39.8%
|
684 57.1%
|
|
NH Hillsborough Manchester 3
|
484 31.7%
|
975 63.8%
|
594 41.3%
|
819 56.9%
|
|
NH Hillsborough Manchester 5
|
315 27.7%
|
762 67.1%
|
678 42.1%
|
888 55.1%
|
|
NH Hillsborough Nashua 5
|
722 40.4%
|
983 55.0%
|
1615 47.7%
|
1656 48.9%
|
|
NH Hillsborough Wilton
|
401 36.6%
|
650 59.4%
|
609 53.4%
|
498 43.7%
|
|
NM Santa Fe 7 Rio En Medio
|
19 13.1%
|
125 86.2%
|
9 19.1%
|
38 80.9%
|
|
NM Santa Fe 25 33 Alameda
|
44 13.5%
|
279 85.8%
|
32 29.1%
|
78 70.9%
|
|
NM Taos Pueblo 13
|
10 4.4%
|
217 95.2%
|
2 2.7%
|
73 97.3%
|
|
TX Harris Houston 34
|
94 20.3%
|
360 77.9%
|
332 25.2%
|
936 71.0%
|
|
|
Official Results U.S. Senate
|
Exit Poll U.S. Senate
|
||
|
|
Republican
|
Democratic
|
Republican
|
Democratic
|
|
|
|
|
|
|
|
NH Hillsborough Manchester 3
|
1078 36.3%
|
1794 60.4%
|
516.5 33.7%
|
946.2 61.8%
|
|
NH Hillsborough Manchester 5
|
993 36.1%
|
1650 60.0%
|
340.4 30.0%
|
737.2 64.9%
|
|
NH Hillsborough Nashua 5
|
2337 45.2%
|
2639 51.0%
|
765.4 42.7%
|
943.6 52.7%
|
|
NH Hillsborough Wilton
|
1010 45.2%
|
1148 51.4%
|
444.7 40.6%
|
606.3 55.4%
|
|
|
President
|
Senate
|
Congress
|
|
|
|
|
|
|
CA LA Taft 9001037A
|
8.8%
|
|
|
|
CA LA Long Beach 3850101A
|
0.5%
|
|
2.6%
|
|
CA LA Berendo 9005399A
|
0.4%
|
|
|
|
CA LA Santa Monica 6250005A
|
6.1%
|
|
|
|
CA LA Topanga 710003A 6A
|
10.5%
|
|
|
|
CA LA Lockhurst 9006489A 90A
|
8.7%
|
|
|
|
CA LA Glendale 2550120A 120B 122A
|
4.0%
|
|
5.6%
|
|
CA LA Locke 9001145A 9002566A
|
0.6%
|
|
2.2%
|
|
CA LA Eagle Rock 9006334A 6335A
|
2.8%
|
|
|
|
CA LA Lynwood 3990015A 16A 18A 19A
|
0.9%
|
|
0.6%
|
|
NH Hillsborough Manchester 3
|
8.8%
|
3.6%
|
4.2%
|
|
NH Hillsborough Manchester 5
|
15.6%
|
11.0%
|
10.4%
|
|
NH Hillsborough Nashua 5
|
6.0%
|
4.2%
|
5.1%
|
|
NH Hillsborough Wilton
|
6.7%
|
8.6%
|
6.9%
|
|
PA Allegheny Pittsburgh W 14 D 8
|
9.2%
|
|
3.2%
|
|
PA Cambria Munster
|
1.8%
|
|
0.7%
|
|
PA Centre Harris Twp 56 57
|
7.0%
|
|
8.9%
|
|
PA Philadelphia D 30 W 5 10
|
1.5%
|
|
1.2%
|
|
|
President
|
Senate
|
Congress
|
|
|
|
|
|
|
CA Alameda 280300 280700
|
11.6%
|
|
13.4%
|
|
MI Oakland West Bloomfield 2
|
19.7%
|
12.6%
|
11.0%
|
|
MI Washtenaw Chelsea 1 2
|
24.4%
|
20.2%
|
24.7%
|
|
NM Santa Fe 7 Rio En Medio
|
0.8%
|
2.5%
|
10.0%
|
|
NM Santa Fe 25 33 Alameda
|
10.4%
|
7.5%
|
8.1%
|
|
NM Taos Pueblo 13
|
1.8%
|
1.2%
|
2.4%
|
|
OH Cuyahoga Beachwood A B N
|
0.1%
|
|
2.7%
|
|
OH Cuyahoga Independence A C F
|
7.7%
|
|
9.8%
|
|
OH Cuyahoga Rocky River 1D 1E 1G
|
13.2%
|
|
8.4%
|
|
TX Harris Houston 34
|
15.0%
|
8.7%
|
13.1%
|
|
|
President
|
U. S. Senate
|
U. S. Congress
|
|||
|
MI West Bloomfield 2
|
Republican
|
Democrat
|
Republican
|
Democrat
|
Republican
|
Democrat
|
|
|
|
|
|
|
|
|
|
2008
|
433 43.5%
|
545 54.7%
|
338 35.0%
|
573 59.4%
|
440 45.4%
|
466 48.1%
|
|
2006
|
|
|
|
|
710 48.8%
|
709 48.7%
|
|
2004
|
654 49.5%
|
656 49.7%
|
|
|
747 59.6%
|
483 38.5%
|
|
2002
|
|
|
379 38.8%
|
577 59.1%
|
550 56.6%
|
399 41.0%
|
|
|
President
|
U. S. Senate
|
U. S. Congress
|
|||
|
MI Chelsea 1 2
|
Republican
|
Democrat
|
Republican
|
Democrat
|
Republican
|
Democrat
|
|
|
|
|
|
|
|
|
|
2008
|
752 39.6%
|
1115 58.7%
|
629 34.0%
|
1152 62.2%
|
745 40.6%
|
993 54.1%
|
|
2006
|
|
|
|
|
885 40.5%
|
1227 56.2%
|
|
2004
|
846 44.4%
|
1032 54.2%
|
|
|
943 53.1%
|
757 42.6%
|
|
2002
|
|
|
N.A.
|
N.A.
|
N.A.
|
N.A.
|
|
|
President
|
U. S. Congress
|
||
|
OH Independence A C F
|
Republican
|
Democrat
|
Republican
|
Democrat
|
|
|
|
|
|
|
|
2008
|
1044 57.2%
|
752 41.2%
|
1060 60.7%
|
648 37.1%
|
|
2006
|
|
|
556 40.1%
|
829 59.9%
|
|
2004
|
918 55.6%
|
732 44.3%
|
600 39.4%
|
814 53.5%
|
|
2002
|
|
|
343 29.0%
|
820 69.4%
|
|
|
President
|
U. S. Congress
|
||
|
OH Rocky River 1D 1E 1G
|
Republican
|
Democrat
|
||
|
|
|
|
Republican
|
Democrat
|
|
2008
|
705 53.4%
|
597 45.2%
|
|
|
|
2006
|
|
|
746 58.7%
|
498 39.2%
|
|
2004
|
643 60.8%
|
415 39.2%
|
512 50.3%
|
505 49.7%
|
|
2002
|
|
|
583 56.2%
|
420 40.5%
|
|
|
|
|
|
|
|
|
Republican
|
Democratic
|
Independent
|
|
Independence A C F
|
|
|
|
|
Paul F. Conroy (L)
|
2 1.1%
|
5 2.0%
|
4 3.5%
|
|
Jim Trakas (R)
|
148 84.6%
|
83 33.6%
|
69 61.1%
|
|
Dennis J. Kucinich (D)
|
25 14.3%
|
159 64.4%
|
40 35.4%
|
|
None
|
11
|
14
|
19
|
|
|
|
|
|
|
Rocky River 1D 1E 1G
|
|
|
|
|
Paul F. Conroy (L)
|
3 1.6%
|
7 3.8%
|
5 5.6%
|
|
Jim Trakas (R)
|
163 88.1%
|
44 23.7%
|
42 47.2%
|
|
Dennis J. Kucinich (D)
|
19 10.3%
|
135 72.6%
|
42 47.2%
|
|
None
|
5
|
10
|
7
|
|
|
Official Results U. S. Congress
|
Exit Poll U. S. Congress
|
||||
|
|
Republican
|
Democratic
|
Green
|
Republican
|
Democratic
|
Green
|
|
|
|
|
|
|
|
|
|
NM Santa Fe 7 Rio En Medio
|
20 10.5%
|
128 67.4%
|
42 22.1%
|
10 7.5%
|
99 74.4%
|
24 18.0%
|
|
NM Santa Fe 25 33 Alameda
|
50 11.7%
|
308 72.1%
|
69 16.2%
|
33 10.4%
|
251 78.9%
|
34 10.7%
|
|
|
Exit Poll Responders
|
Non-Responders
|
||
|
President
|
McCain
|
Obama
|
McCain
|
Obama
|
|
|
|
|
|
|
|
NM Santa Fe 7 Rio En Medio
|
19 13.3%
|
120 83.9%
|
8 16.3%
|
41 83.7%
|
|
NM Santa Fe 25 33 Alameda
|
51 15.6%
|
267 81.7%
|
40 37.7%
|
65 61.3%
|
|
|
Exit Poll Responders
|
Non-Responders
|
||
|
U. S. Senate
|
Republican
|
Democratic
|
Republican
|
Democratic
|
|
|
|
|
|
|
|
NM Santa Fe 7 Rio En Medio
|
19 13.1%
|
125 86.2%
|
9 19.1%
|
38 80.9%
|
|
NM Santa Fe 25 33 Alameda
|
44 13.5%
|
279 85.8%
|
32 29.1%
|
78 70.9%
|
|
|
Exit Poll Responders
|
Non-Responders
|
||||
|
U. S. Congress
|
Republican
|
Democratic
|
Green
|
Republican
|
Democratic
|
Green
|
|
|
|
|
|
|
|
|
|
NM Santa Fe 7 Rio En Medio
|
10 7.5%
|
99 74.4%
|
24 18.0%
|
10 17.5%
|
29 50.9%
|
18 31.6%
|
|
NM Santa Fe 25 33 Alameda
|
33 10.4%
|
251 78.9%
|
34 10.7%
|
17 15.6%
|
57 52.3%
|
35 32.1%
|
|
|
Republican
|
Democratic
|
Other
|
None
|
|
|
|
|
|
|
|
Taft
|
169 29.6%
|
276 48.6%
|
18 3.2%
|
106 18.6%
|
|
Santa Monica
|
113 14.8%
|
451 59.2%
|
34 4.5%
|
164 21.5%
|
|
Topanga
|
97 9.0%
|
664 61.5%
|
76 7.1%
|
241 22.3%
|
|
Lockhurst
|
353 29.8%
|
570 48.1%
|
61 5.2%
|
202 17.0%
|
|
Glendale
|
345 20.5%
|
810 48.1%
|
76 4.5%
|
453 26.9%
|
|
|
Republican
|
Democratic
|
Other
|
None
|
|
|
|
|
|
|
|
Taft
|
79 25.5%
|
170 54.8%
|
12 3.9%
|
49 15.8%
|
|
Santa Monica
|
56 10.5%
|
356 66.7%
|
27 5.1%
|
95 17.8%
|
|
Topanga
|
21 3.6%
|
388 66.4%
|
61 10.4%
|
114 19.5%
|
|
Lockhurst
|
134 22.4%
|
317 53.1%
|
51 8.5%
|
95 15.9%
|
|
Glendale
|
85 13.3%
|
352 55.1%
|
42 6.6%
|
160 25.0%
|
|
|
Republican
|
Democratic
|
Other
|
None
|
|
|
|
|
|
|
|
Taft
|
90 34.7%
|
106 40.9%
|
6 2.3%
|
57 22.0%
|
|
Santa Monica
|
57 25.0%
|
95 41.7%
|
7 3.1%
|
69 30.3%
|
|
Topanga
|
76 15.4%
|
276 55.9%
|
15 3.0%
|
127 25.7%
|
|
Lockhurst
|
219 37.2%
|
253 43.0%
|
10 1.7%
|
107 18.2%
|
|
Glendale
|
260 24.9%
|
458 43.8%
|
34 3.3%
|
293 28.0%
|
|
|
Exit Poll Responders
|
Non-Responders
|
||
|
|
McCain
|
Obama
|
McCain
|
Obama
|
|
|
|
|
|
|
|
Taft
|
88 28.7%
|
214 69.7%
|
113 44.8%
|
132 52.4%
|
|
Santa Monica
|
56 10.6%
|
465 87.7%
|
72 32.3%
|
149 66.8%
|
|
Topanga
|
26 4.5%
|
535 93.5%
|
103 20.4%
|
383 76.0%
|
|
Lockhurst
|
151 25.8%
|
421 72.0%
|
254 43.9%
|
322 55.6%
|
|
Glendale
|
106 16.7%
|
511 80.7%
|
287 28.3%
|
707 69.7%
|
|
|
Presidential Preference
|
Party Affiliation
|
||||
|
|
McCain
|
Obama
|
Ratio
|
Rep.
|
Dem.
|
Ratio
|
|
|
|
|
|
|
|
|
|
Taft
|
113
|
132
|
1 : 1.17
|
90
|
106
|
1 : 1.18
|
|
Santa Monica
|
72
|
149
|
1 : 2.07
|
57
|
95
|
1 : 1.67
|
|
Topanga
|
103
|
383
|
1 : 3.72
|
76
|
276
|
1 : 3.63
|
|
Lockhurst
|
254
|
322
|
1 : 1.27
|
219
|
253
|
1 : 1.16
|
|
Glendale
|
287
|
707
|
1 : 2.46
|
260
|
458
|
1 : 2.22
|
|
|
Republicans
|
Democrats
|
Other / None
|
|||
|
|
McCain
|
Obama
|
McCain
|
Obama
|
McCain
|
Obama
|
|
|
|
|
|
|
|
|
|
Taft
|
60 75.9%
|
17 21.5%
|
14 8.3%
|
152 90.5%
|
14 23.3%
|
45 75.0%
|
|
Santa Monica
|
36 65.5%
|
16 29.1%
|
4 1.1%
|
348 98.3%
|
16 13.2%
|
101 83.5%
|
|
Topanga
|
11 52.4%
|
10 47.6%
|
6 1.6%
|
372 98.2%
|
9 5.2%
|
153 89.0%
|
|
Lockhurst
|
94 73.4%
|
28 21.9%
|
18 5.8%
|
291 93.3%
|
39 26.9%
|
102 70.3%
|
|
Glendale
|
59 71.1%
|
21 25.3%
|
12 3.4%
|
337 95.7%
|
35 17.7%
|
153 77.3%
|
|
|
President
|
U. S. Congress
|
||
|
Pittsburgh W 14 D 8
|
Republican
|
Democrat
|
Green
|
Democrat
|
|
|
|
|
|
|
|
2008
|
108 21.1%
|
401 78.2%
|
54 11.5%
|
410 87.4%
|
|
2006
|
|
|
25 7.3%
|
312 91.2%
|
|
2004
|
109 21.0%
|
409 78.7%
|
|
|
|
|
President
|
||
|
Pittsburgh Ward 14
|
Republican
|
Democrat
|
Others
|
|
|
|
|
|
|
2008
|
4,318 20.13%
|
16,870 78.64%
|
263 1.23%
|
|
2004
|
4,296 21.18%
|
15,865 78.20%
|
126 0.62%
|
|
|
President
|
U. S. Congress
|
||||
|
Harris Twp 56 57
|
Republican
|
Democrat
|
Other
|
Republican
|
Democrat
|
Other
|
|
|
|
|
|
|
|
|
|
2008
|
1379 46.7%
|
1540 52.1%
|
36 1.2%
|
1616 55.6%
|
1229 42.3%
|
60 2.1%
|
|
2006
|
|
|
|
1301 58.8%
|
908 41.0%
|
5 0.2%
|
|
2004
|
1553 53.3%
|
1341 46.1%
|
17 0.6%
|
|
|
|
|
|
2008 Voters (Including Absentees)
|
||
|
Harris Twp 56 57
|
Republican
|
Democratic
|
Other / None
|
|
|
|
|
|
|
Responders
|
532 39.5%
|
673 49.9%
|
143 10.6%
|
|
Non-Responders
|
883 54.6%
|
533 32.9%
|
202 12.5%
|
|
Total
|
1415 47.7%
|
1206 40.7%
|
345 11.6%
|
|
|
Exit Poll Responders
|
Non-Responders
|
||
|
President
|
McCain
|
Obama
|
McCain
|
Obama
|
|
|
|
|
|
|
|
PA Centre Harris Twp 56 57
|
490 37.1%
|
816 61.8%
|
889 54.4%
|
724 44.3%
|
|
|
Exit Poll Responders
|
Non-Responders
|
||
|
U. S. Congress
|
Republican
|
Democratic
|
Republican
|
Democratic
|
|
|
|
|
|
|
|
PA Centre Harris Twp 56 57
|
577 45.0%
|
684 53.3%
|
1039 64.1%
|
545 33.6%
|
|
|
President
|
Senate
|
Congress
|
|
|
|
|
|
|
NH Hillsborough Manchester 3
|
8.8%
|
3.6%
|
4.2%
|
|
NH Hillsborough Manchester 5
|
15.6%
|
11.0%
|
10.4%
|
|
NH Hillsborough Nashua 5
|
6.0%
|
4.2%
|
5.1%
|
|
NH Hillsborough Wilton
|
6.7%
|
8.6%
|
6.9%
|
|
|
McCain
|
Obama
|
Others
|
Votes
Counted
|
Actual
Voters
|
|
|
|
|
|
|
|
|
NH Hillsborough Manchester 3
|
1013 33.2%
|
2003 65.7%
|
34 1.1%
|
3050
|
3089
|
|
NH Hillsborough Manchester 5
|
992 35.6%
|
1761 63.2%
|
32 1.1%
|
2785
|
2890
|
|
NH Hillsborough Nashua 5
|
2499 47.2%
|
2741 51.8%
|
49 0.9%
|
5289
|
5380
|
|
NH Hillsborough Wilton
|
1026 44.6%
|
1248 54.3%
|
24 1.0%
|
2298
|
2101
|
|
NH Hillsborough Manchester 3
|
McCain
|
Obama
|
Others
|
|
|
|
|
|
|
Partial Count
|
955 33.2%
|
1876 65.2%
|
46 1.6%
|
|
Additional Count
|
58 31.4%
|
127 68.6%
|
-12 N.A.
|
|
Final Count
|
1013 33.2%
|
2003 65.7%
|
34 1.1%
|
|
NH Hillsborough Nashua 5
|
McCain
|
Obama
|
Others
|
|
|
|
|
|
|
Partial Count
|
1637 40.1%
|
2370 58.0%
|
79 1.9%
|
|
Additional Count
|
862 69.9%
|
371 30.1%
|
-30 N.A.
|
|
Final Count
|
2499 47.2%
|
2741 51.8%
|
49 0.9%
|
|
|
President
|
U. S. Senate
|
U. S. Congress
|
|||
|
Manchester 3
|
Republican
|
Democrat
|
Republican
|
Democrat
|
Republican
|
Democrat
|
|
|
|
|
|
|
|
|
|
2008
|
1013 33.2%
|
2003 65.7%
|
1078 36.3%
|
1794 60.4%
|
996 34.5%
|
1809 62.7%
|
|
2006
|
|
|
|
|
584 41.3%
|
822 58.1%
|
|
2004
|
1079 38.0%
|
1744 61.5%
|
|
|
1367 49.9%
|
1366 49.8%
|
|
2002
|
|
|
739 44.3%
|
889 53.3%
|
765 46.5%
|
800 48.7%
|
|
|
President
|
U. S. Senate
|
U. S. Congress
|
|||
|
Manchester 5
|
Republican
|
Democrat
|
Republican
|
Democrat
|
Republican
|
Democrat
|
|
|
|
|
|
|
|
|
|
2008
|
992 35.6%
|
1761 63.2%
|
993 36.1%
|
1650 60.0%
|
925 34.9%
|
1632 61.6%
|
|
2006
|
|
|
|
|
563 40.9%
|
809 58.8%
|
|
2004
|
1217 43.2%
|
1581 56.2%
|
|
|
1461 54.4%
|
1218 45.3%
|
|
2002
|
|
|
822 46.1%
|
922 51.7%
|
866 49.5%
|
828 47.3%
|
|
|
President
|
U. S. Senate
|
U. S. Congress
|
|||
|
Nashua 5
|
Republican
|
Democrat
|
Republican
|
Democrat
|
Republican
|
Democrat
|
|
|
|
|
|
|
|
|
|
2008
|
2499 47.2%
|
2741 51.8%
|
2337 45.2%
|
2639 51.0%
|
2239 45.3%
|
2580 52.2%
|
|
2006
|
|
|
|
|
1266 45.9%
|
1445 52.3%
|
|
2004
|
2443 48.1%
|
2603 51.2%
|
|
|
2816 58.2%
|
1838 38.0%
|
|
2002
|
|
|
1590 47.6%
|
1657 49.6%
|
1775 53.4%
|
1467 44.2%
|
|
|
President
|
U. S. Senate
|
U. S. Congress
|
|||
|
Wilton
|
Republican
|
Democrat
|
Republican
|
Democrat
|
Republican
|
Democrat
|
|
|
|
|
|
|
|
|
|
2008
|
1026 44.6%
|
1248 54.3%
|
1010 45.2%
|
1148 51.4%
|
931 42.8%
|
1203 55.3%
|
|
2006
|
|
|
|
|
630 45.6%
|
737 53.3%
|
|
2004
|
1032 45.8%
|
1209 53.6%
|
|
|
1242 56.3%
|
865 39.2%
|
|
2002
|
|
|
720 46.8%
|
753 49.0%
|
875 57.4%
|
589 38.6%
|
|
|
President
|
U. S. Senate
|
U. S. Congress
|
|||
|
Manchester
|
Republican
|
Democrat
|
Republican
|
Democrat
|
Republican
|
Democrat
|
|
|
|
|
|
|
|
|
|
2008
|
21,192 44.0%
|
26,526 55.1%
|
21,236 44.8%
|
24,799 52.3%
|
19,675 42.5%
|
25,471 55.0%
|
|
2006
|
|
|
|
|
12,827 48.1%
|
13,819 51.8%
|
|
2004
|
23,286 49.9%
|
23,116 49.5%
|
|
|
27,408 61.0%
|
17,457 38.8%
|
|
2002
|
|
|
16,581 52.9%
|
14,118 45.1%
|
17,386 56.1%
|
12,509 40.4%
|
|
|
President
|
U. S. Senate
|
U. S. Congress
|
|||
|
Nashua
|
Republican
|
Democrat
|
Republican
|
Democrat
|
Republican
|
Democrat
|
|
|
|
|
|
|
|
|
|
2008
|
17,325 42.6%
|
22,902 56.4%
|
16,765 42.3%
|
21,273 53.7%
|
15,956 42.0%
|
21,006 55.3%
|
|
2006
|
|
|
|
|
9,523 44.0%
|
12,114 55.9%
|
|
2004
|
18,016 45.2%
|
21,587 54.1%
|
|
|
21,132 57.8%
|
15,382 42.1%
|
|
2002
|
|
|
11,511 46.0%
|
12,947 51.8%
|
13,222 52.9%
|
11,187 44.7%
|
|
|
2008
|
2004
|
||||
|
|
McCain
|
Obama
|
Others
|
Bush
|
Kerry
|
Others
|
|
|
|
|
|
|
|
|
|
Nashua Ward 1
|
2475 45.1%
|
2952 53.8%
|
55
|
2594 47.5%
|
2825 51.8%
|
37
|
|
Nashua Ward 2
|
2072 44.5%
|
2535 54.4%
|
49
|
2198 48.1%
|
2333 51.1%
|
39
|
|
Nashua Ward 3
|
1789 40.5%
|
2594 58.8%
|
30
|
1922 42.2%
|
2594 57.0%
|
34
|
|
Nashua Ward 4
|
945 31.3%
|
2038 67.6%
|
34
|
1081 35.9%
|
1904 63.2%
|
27
|
|
Nashua Ward 5
|
2499 47.2%
|
2741 51.8%
|
49
|
2443 48.1%
|
2603 51.2%
|
35
|
|
Nashua Ward 6
|
1637 40.3%
|
2370 58.3%
|
56
|
1773 42.8%
|
2347 56.7%
|
22
|
|
Nashua Ward 7
|
1673 43.1%
|
2166 55.8%
|
43
|
1712 45.6%
|
2012 53.6%
|
32
|
|
Nashua Ward 8
|
1845 40.8%
|
2632 58.2%
|
47
|
1903 44.3%
|
2366 55.1%
|
25
|
|
Nashua Ward 9
|
2390 45.0%
|
2874 54.1%
|
46
|
2390 47.6%
|
2603 51.9%
|
25
|
|
|
2008
|
2004
|
||||
|
|
McCain
|
Obama
|
Others
|
Bush
|
Kerry
|
Others
|
|
|
|
|
|
|
|
|
|
Manchester 1
|
2480 45.7%
|
2913 53.7%
|
29
|
2739 49.3%
|
2776 50.0%
|
39
|
|
Manchester 2
|
2055 43.2%
|
2668 56.0%
|
39
|
2209 48.4%
|
2334 51.2%
|
18
|
|
Manchester 3
|
1013 33.2%
|
2003 65.7%
|
34
|
1079 38.0%
|
1744 61.5%
|
14
|
|
Manchester 4
|
1336 39.7%
|
1982 59.0%
|
44
|
1591 46.8%
|
1791 52.7%
|
18
|
|
Manchester 5
|
992 35.6%
|
1761 63.2%
|
32
|
1217 43.2%
|
1581 56.2%
|
17
|
|
Manchester 6
|
2324 48.0%
|
2489 51.4%
|
32
|
2263 53.4%
|
1954 46.1%
|
21
|
|
Manchester 7
|
1652 44.6%
|
2016 54.5%
|
33
|
1795 49.7%
|
1788 49.5%
|
30
|
|
Manchester 8
|
2472 50.6%
|
2372 48.5%
|
42
|
2613 56.6%
|
1983 42.9%
|
22
|
|
Manchester 9
|
1819 45.1%
|
2191 54.3%
|
26
|
2022 51.1%
|
1912 48.3%
|
21
|
|
Manchester 10
|
1832 45.1%
|
2181 53.7%
|
48
|
2056 51.5%
|
1921 48.1%
|
18
|
|
Manchester 11
|
1249 43.1%
|
1622 56.0%
|
26
|
1509 50.4%
|
1471 49.1%
|
16
|
|
Manchester 12
|
1968 45.4%
|
2328 53.7%
|
42
|
2193 53.8%
|
1861 45.7%
|
19
|
|
|
18-29
|
30-59
|
60+
|
||||||
|
|
Rep.
|
Dem.
|
Ind.
|
Rep.
|
Dem.
|
Ind.
|
Rep.
|
Dem.
|
Ind.
|
|
|
|
|
|
|
|
|
|
|
|
|
Manchester 3
|
71
13.2%
|
240
44.5%
|
228
42.3%
|
163
21.1%
|
333
43.0%
|
278
35.9%
|
53
25.1%
|
101
47.9%
|
57
27.0%
|
|
|
|
|
|
|
|
|
|
|
|
|
Manchester 5
|
49
13.8%
|
178
50.3%
|
127
35.9%
|
121
18.7%
|
320
49.5%
|
205
31.7%
|
32
23.5%
|
71
52.2%
|
33
24.3%
|
|
|
|
|
|
|
|
|
|
|
|
|
Nashua 5
|
46
16.1%
|
110
38.6%
|
129
45.3%
|
299
27.1%
|
355
32.2%
|
450
40.8%
|
97
26.1%
|
147
39.5%
|
128
34.4%
|
|
|
|
|
|
|
|
|
|
|
|
|
Wilton
|
37
18.2%
|
74
36.5%
|
92
45.3%
|
188
25.8%
|
255
34.9%
|
287
39.3%
|
44
25.9%
|
72
42.4%
|
54
31.8%
|
|
|
|
|
|
|
|
|
|
|
|
|
Total
|
203
14.7%
|
602
43.6%
|
576
41.7%
|
771
23.7%
|
1263
38.8%
|
1220
37.5%
|
226
25.4%
|
391
44.0%
|
272
30.6%
|
|
|
18-29
|
30-59
|
60+
|
|||
|
President
|
McCain
|
Obama
|
McCain
|
Obama
|
McCain
|
Obama
|
|
|
|
|
|
|
|
|
|
Manchester 3
|
95 17.8%
|
430 80.4%
|
220 29.3%
|
513 68.4%
|
77 37.9%
|
124 61.1%
|
|
Manchester 5
|
65 18.7%
|
277 79.6%
|
166 26.9%
|
437 70.7%
|
43 33.1%
|
86 66.2%
|
|
Nashua 5
|
95 33.6%
|
180 63.6%
|
476 43.5%
|
603 55.1%
|
152 42.2%
|
197 54.7%
|
|
Wilton
|
62 30.5%
|
132 65.0%
|
277 38.1%
|
437 60.1%
|
64 38.1%
|
101 60.1%
|
|
|
18-29
|
30-59
|
60+
|
|||
|
U. S. Senate
|
Sununu (R)
|
Shaheen (D)
|
Sununu (R)
|
Shaheen (D)
|
Sununu (R)
|
Shaheen (D)
|
|
|
|
|
|
|
|
|
|
Manchester 3
|
149 28.5%
|
344 65.8%
|
250 33.1%
|
471 62.3%
|
77 36.8%
|
129 61.7%
|
|
Manchester 5
|
85 24.7%
|
244 70.9%
|
175 28.0%
|
416 66.5%
|
45 34.4%
|
79 60.3%
|
|
Nashua 5
|
110 39.6%
|
149 53.6%
|
450 41.5%
|
588 54.2%
|
144 39.2%
|
211 57.5%
|
|
Wilton
|
59 31.4%
|
118 62.8%
|
272 37.9%
|
415 57.9%
|
58 35.4%
|
104 63.4%
|
|
|
18-29
|
30-59
|
60+
|
|||
|
U. S. Congress
|
Republican
|
Democratic
|
Republican
|
Democratic
|
Republican
|
Democratic
|
|
|
|
|
|
|
|
|
|
Manchester 3
|
136 26.9%
|
340 67.2%
|
223 30.4%
|
478 65.2%
|
65 31.9%
|
132 64.7%
|
|
Manchester 5
|
79 24.2%
|
232 70.9%
|
166 27.1%
|
420 68.5%
|
40 31.3%
|
80 62.5%
|
|
Nashua 5
|
78 30.2%
|
165 64.0%
|
436 42.5%
|
550 53.6%
|
147 40.9%
|
200 55.7%
|
|
Wilton
|
55 31.3%
|
113 64.2%
|
250 36.1%
|
426 61.6%
|
60 37.5%
|
100 62.5%
|
|
Manchester 3
|
18-29
|
30-59
|
60+
|
Totals
|
|
|
|
|
|
|
|
Responders
|
542 35.5%
|
774 50.7%
|
211 13.8%
|
1527
|
|
Refusals
|
150 19.6%
|
419 54.8%
|
195 25.5%
|
764
|
|
Totals
|
692 30.2%
|
1193 52.1%
|
406 17.7%
|
2291
|
|
Manchester 5
|
18-29
|
30-59
|
60+
|
Totals
|
|
|
|
|
|
|
|
Responders
|
354 31.2%
|
646 56.9%
|
136 12.0%
|
1136
|
|
Refusals
|
110 17.3%
|
404 63.5%
|
122 19.2%
|
636
|
|
Totals
|
464 26.2%
|
1050 59.3%
|
258 14.6%
|
1772
|
|
Wilton
|
18-29
|
30-59
|
60+
|
Totals
|
|
|
|
|
|
|
|
Responders
|
203 18.4%
|
730 66.2%
|
170 15.4%
|
1103
|
|
Refusals
|
69 11.6%
|
326 54.8%
|
200 33.6%
|
595
|
|
Totals
|
272 16.0%
|
1056 62.2%
|
370 21.8%
|
1698
|
|
|
Unadjusted
|
Adjusted
|
Change
|
||
|
President
|
McCain
|
Obama
|
McCain
|
Obama
|
|
|
|
|
|
|
|
|
|
Manchester 3
|
401 26.1%
|
1106 72.0%
|
414.7 27.0%
|
1091.2 71.1%
|
1.8%
|
|
Manchester 5
|
286 25.0%
|
832 72.8%
|
291.8 25.6%
|
824.4 72.3%
|
1.1%
|
|
Wilton
|
416 36.7%
|
692 61.1%
|
417.9 36.9%
|
690.6 61.0%
|
0.3%
|
|
|
Unadjusted
|
Adjusted
|
Change
|
||
|
U. S. Senate
|
Sununu (R)
|
Shaheen (D)
|
Sununu (R)
|
Shaheen (D)
|
|
|
|
|
|
|
|
|
|
Manchester 3
|
484 31.7%
|
975 63.8%
|
490.4 32.0%
|
973.3 63.6%
|
0.5%
|
|
Manchester 5
|
315 27.7%
|
762 67.1%
|
318.4 28.0%
|
757.3 66.7%
|
0.7%
|
|
Wilton
|
401 36.6%
|
650 59.4%
|
401.1 36.6%
|
652.9 59.6%
|
0.2%
|
|
|
Unadjusted
|
Adjusted
|
Change
|
||
|
U. S. Congress
|
Republican
|
Democratic
|
Republican
|
Democratic
|
|
|
|
|
|
|
|
|
|
Manchester 3
|
432 29.3%
|
972 65.9%
|
436.2 29.5%
|
971.9 65.8%
|
0.3%
|
|
Manchester 5
|
294 27.0%
|
745 68.3%
|
296.9 27.2%
|
742.6 68.1%
|
0.4%
|
|
Wilton
|
371 35.5%
|
651 62.2%
|
373.8 35.7%
|
652.3 62.2%
|
0.2%
|
|
|
Men
|
Women
|
|
|
|
|
|
Manchester 3
|
702 46.1%
|
822 53.9%
|
|
Manchester 5
|
498 44.0%
|
635 56.0%
|
|
Nashua 5
|
751 42.8%
|
1003 57.2%
|
|
Wilton
|
486 44.2%
|
614 55.8%
|
|
|
|
|
|
Total
|
2437 44.2%
|
3074 55.8%
|
|
|
Men
|
Women
|
Difference
|
||
|
President
|
McCain
|
Obama
|
McCain
|
Obama
|
|
|
|
|
|
|
|
|
|
Manchester 3
|
198 29.0%
|
466 68.2%
|
189 23.6%
|
602 75.2%
|
12.4%
|
|
Manchester 5
|
138 28.8%
|
330 68.8%
|
136 22.2%
|
466 76.1%
|
13.9%
|
|
Nashua 5
|
332 44.8%
|
388 52.4%
|
389 39.3%
|
589 59.4%
|
12.5%
|
|
Wilton
|
198 40.9%
|
271 56.0%
|
207 33.9%
|
394 64.5%
|
15.5%
|
|
|
Men
|
Women
|
Difference
|
||
|
U. S. Senate
|
Sununu (R)
|
Shaheen (D)
|
Sununu (R)
|
Shaheen (D)
|
|
|
|
|
|
|
|
|
|
Manchester 3
|
248 36.2%
|
399 58.2%
|
226 28.3%
|
545 68.1%
|
17.8%
|
|
Manchester 5
|
160 33.1%
|
294 60.7%
|
147 23.9%
|
442 71.8%
|
20.3%
|
|
Nashua 5
|
339 45.6%
|
367 49.4%
|
361 36.9%
|
576 58.9%
|
18.2%
|
|
Wilton
|
194 41.4%
|
253 53.9%
|
196 32.8%
|
381 63.7%
|
18.4%
|
|
|
Men
|
Women
|
Difference
|
||
|
U. S. Congress
|
Republican
|
Democratic
|
Republican
|
Democratic
|
|
|
|
|
|
|
|
|
|
Manchester 3
|
220 33.0%
|
412 61.9%
|
203 26.1%
|
539 69.4%
|
14.4%
|
|
Manchester 5
|
139 29.0%
|
310 64.6%
|
147 25.1%
|
420 71.8%
|
11.1%
|
|
Nashua 5
|
295 41.5%
|
378 53.2%
|
361 39.0%
|
533 57.6%
|
6.9%
|
|
Wilton
|
185 40.5%
|
258 56.5%
|
178 31.5%
|
377 66.7%
|
19.2%
|
|
|
Unadjusted
|
Adjusted
|
Change
|
||
|
President
|
McCain
|
Obama
|
McCain
|
Obama
|
|
|
|
|
|
|
|
|
|
Manchester 3
|
401 26.1%
|
1106 72.0%
|
404.1 26.3%
|
1101.8 71.7%
|
0.5%
|
|
Manchester 5
|
286 25.0%
|
832 72.8%
|
290.2 25.4%
|
827.1 72.4%
|
0.8%
|
|
Nashua 5
|
746 41.4%
|
1022 56.7%
|
752.9 41.8%
|
1013.2 56.2%
|
0.9%
|
|
Wilton
|
416 36.7%
|
692 61.1%
|
420.5 37.1%
|
686.6 60.6%
|
0.9%
|
|
|
Unadjusted
|
Adjusted
|
Change
|
||
|
U. S. Senate
|
Sununu (R)
|
Shaheen (D)
|
Sununu (R)
|
Shaheen (D)
|
|
|
|
|
|
|
|
|
|
Manchester 3
|
484 31.7%
|
975 63.8%
|
488.6 32.0%
|
969.4 63.4%
|
0.7%
|
|
Manchester 5
|
315 27.7%
|
762 67.1%
|
321.1 28.3%
|
754.7 66.4%
|
1.3%
|
|
Nashua 5
|
722 40.4%
|
983 55.0%
|
733.6 41.0%
|
972.2 54.4%
|
1.2%
|
|
Wilton
|
401 36.6%
|
650 59.4%
|
406.1 37.1%
|
643.6 58.8%
|
1.1%
|
|
|
Unadjusted
|
Adjusted
|
Change
|
||
|
U. S. Congress
|
Republican
|
Democratic
|
Republican
|
Democratic
|
|
|
|
|
|
|
|
|
|
Manchester 3
|
432 29.3%
|
972 65.9%
|
435.9 29.5%
|
967.9 65.6%
|
0.5%
|
|
Manchester 5
|
294 27.0%
|
745 68.3%
|
297.3 27.2%
|
742.3 67.9%
|
0.6%
|
|
Nashua 5
|
667 39.7%
|
943 56.1%
|
671.2 39.9%
|
939.5 55.8%
|
0.5%
|
|
Wilton
|
371 35.5%
|
651 62.2%
|
376.8 36.0%
|
645.7 61.7%
|
1.0%
|
|
|
President
|
Senate
|
Congress
|
|
|
|
|
|
|
NH Hillsborough Manchester 3
|
6.5%
|
2.8%
|
3.4%
|
|
NH Hillsborough Manchester 5
|
13.7%
|
9.0%
|
9.4%
|
|
NH Hillsborough Nashua 5
|
5.1%
|
3.0%
|
4.6%
|
|
NH Hillsborough Wilton
|
5.5%
|
7.3%
|
5.7%
|
|
|
Men
|
Women
|
||||
|
|
Republican
|
Democratic
|
Other / None
|
Republican
|
Democratic
|
Other / None
|
|
|
|
|
|
|
|
|
|
Manchester 3
|
145 20.7%
|
254 36.2%
|
303 43.2%
|
140 17.0%
|
415 50.5%
|
267 32.5%
|
|
Manchester 5
|
98 19.7%
|
238 47.8%
|
162 32.5%
|
107 16.9%
|
327 51.5%
|
201 31.7%
|
|
Nashua 5
|
217 28.9%
|
234 31.2%
|
300 39.9%
|
227 22.6%
|
378 37.7%
|
398 39.7%
|
|
Wilton
|
135 27.8%
|
154 31.7%
|
197 40.5%
|
138 22.5%
|
243 39.6%
|
233 37.9%
|
|
|
|
|
|
|
|
|
|
Total
|
595 24.4%
|
880 36.1%
|
962 39.5%
|
612 19.9%
|
1363 44.3%
|
1099 35.8%
|
|
|
White
|
Black
|
Latino
|
Mixed/Other
|
Total
|
|
|
|
|
|
|
|
|
Manchester 3
|
1284 84.4%
|
61 4.0%
|
81 5.3%
|
95 6.2%
|
1521
|
|
Manchester 5
|
836 74.4%
|
81 7.2%
|
131 11.7%
|
75 6.7%
|
1123
|
|
Nashua 5
|
1566 89.7%
|
37 2.2%
|
44 2.5%
|
99 5.7%
|
1746
|
|
Wilton
|
1063 96.6%
|
3 0.3%
|
8 0.7%
|
26 2.4%
|
1100
|
|
|
|
|
|
|
|
|
|
4749 86.5%
|
182 3.3%
|
264 4.8%
|
295 5.4%
|
5490
|
| Attachment | Size |
|---|---|
| EDA-2008-EVEP-Citizen-Exit-Polls.pdf [17] | 469.49 KB |
| Congressionial-Adjusted-Party-Affiliation.pdf [21] | 60.01 KB |
| Senate-Adjusted-Party-Affiliation.pdf [22] | 31.27 KB |
| New-Hampshire-Adjusted-Age.pdf [23] | 51.4 KB |
| New-Hampshire-Adjusted-Gender.pdf [24] | 52.55 KB |
| Pennsylvania-Adjusted-Age-Gender.pdf [25] | 29.57 KB |
Related article: The complete report, Citizen Exit Polls in Los Angeles County: An In-Depth Analysis [18], by R. H. Phillips
By Sally Castleman and Jonathan Simon
This report presents evidence that in the November 2008 election the tabulation of the vote for California’s Proposition 8, the ballot initiative repealing marriage equality, was probably corrupted. It is beyond the scope of this study to know if any corruption was due to honest error or intentional fraud. Further investigation is warranted.
Much media attention has been focused on California over the past several years regarding gay marriage, abortion, and other hot-button social issues. In November 2008, two such issues appeared on the California ballot: Proposition 8 outlawed marriage equality (a “yes” vote opposed same-sex marriage); Proposition 4 mandated a waiting period and parental notification before non-emancipated minors were allowed an abortion (similar measures had been defeated twice before).
Election Defense Alliance [26], a national nonprofit group dedicated to restoring integrity and public accountability to the electoral processes, worked with several other election integrity groups to conduct public election verification exit polls (“EVEP”) in eight states in November. The polls were meant to validate or detect problems with the official vote counts. Ten sites, representing 19 precincts, were located in Los Angeles County, California. This paper presents the analysis of the L.A. County polling results as they pertain to Proposition 8.
The need.
Throughout history, elections have created opportunities for fraud, from massive outcome- determinative actions to small local shenanigans. Fraud has been perpetrated by the voters, the parties, election officials, programmers, technicians and others with access to the voting equipment itself. As governments have become larger, more powerful, and in control of more money, the motive for election theft has, if anything, increased. With the advent and proliferation of electronic, computerized, software-driven election equipment, the available means have increased dramatically and have become available to insiders, outsiders, and hackers even physically far removed from any voting or tabulating site.
Thus the need to validate or verify official results has become of extreme importance. If we, the citizenry, cannot know that the official election outcomes are valid, democracy is in serious jeopardy—this is equally true whether the election is occurring abroad in a third-world nation or here at home in the presumed “beacon of democracy.” When counting is done inside computers, the public can no longer observe that the votes are counted accurately. More and more people are coming to understand that with secret software controlling the counting and tabulating of our votes, the processes are no longer transparent and no one can be sure that the announced election results are accurate.
In the absence of verifiable election procedures and public accountability, one of the few remaining ways to determine whether an election has been properly counted is through exit polls. Exit polls are routinely used to verify election results in Europe and elsewhere, and through 2004 the mass media in the US conducted exit polls that were considered very reliable. Since 2005, however, the broadcast media no longer make their raw data from exit polls available to the public, and the “projections” announced on election night come from a proprietary mix of exit poll data and official count results.
In 2008 “official” exit polls, commissioned by the National Election Pool (NEP)—comprised of ABC, CBS, CNN, FOX, NBC and the Associated Press—were run by Edison Media Research and Mitofsky International, commonly referred to as Edison-Mitofsky, using a polling method very different from EVEP. Edison-Mitofsky takes only a small sample of voters as they are leaving a small sample of polling sites, initially stratify their raw results according to their best estimate of the electorate’s composition (an estimate based, at least in part, on exit polls from prior elections which have been adjusted to match the official results and thereby demographically distorted to the extent that those results were subject to mistabulation), and progressively adjust those results to match the official results as these become available through the course of the evening.
Thus, from the standpoint of verification, the released media exit polls represent polluted data. While they may shed some important light on the conduct of the election (for example, if the adjusted exit poll results are forced to present a highly unlikely or distorted demographic profile of the electorate), there is a need for independent exit polls that are designed specifically to verify official tabulations and take a different approach in order to do so.
The method.
In November 2008 two election reform groups, Election Integrity (EI) and Election Defense Alliance (EDA), conducted exit polls at 70 sites in 10 states. Their method, Election Verification Exit Polling, EVEP, had been developed by Professor Steve Freeman of EI, Dr. Jonathan Simon of EDA, and Professor Ken Warren, President of The Warren Poll. The protocol had been employed in two prior elections on a smaller scale – i.e., at fewer sites.
Unlike traditional exit polls that use sampling methods to predict wide geographic area results, EVEP measures only the accuracy of official results at any given polling site. The EVEP methodology is meant to answer, for each polling site where it is employed, the single question: “Were the votes from this polling site correctly counted?” In this way, much of the uncertainty that plagues media exit polls is avoided. With the EVEP system it is not necessary to find precincts representative of the jurisdiction as a whole, or to poll a representative sampling by gender, race, age or party affiliation, as long as the results can be weighted to yield a correct sample for that particular site.
Freeman calls the difference between exit poll percentages and the official tally for the given site Within Precinct Disparity or WPD.
The basic question asked in this paper is whether the WPD for the polled sites was within statistically-expected bounds and whether the detailed pattern of disparity suggests that the WPD resulted from a flaw in the exit polls or a flaw in the official vote count.
The protocol.
A one-page questionnaire is prepared, regarding several contests in each locale as well as basic demographic data. A “baseline race,” an election contest with an easily-predicted outcome, is included at each site for comparison during analysis. A questionnaire on a clipboard is handed to each voter as she or he exits the polling station. Voters are asked to participate by filling in the questionnaire privately and dropping it into a “ballot box,” thus ensuring anonymity. Volunteers are supplied forms on which to note those voters who are approached but choose not to participate. The “refusal” data includes gender, apparent racial background and approximate age. Gender, race, and age range are also filled in on the questionnaires by those voters who participate. Respondents are also asked to indicate party affiliation.
Multiple poll-takers work at every site throughout the entire day, beginning before the polls open, with the goal of reaching every voter. Training is mandatory and poll-takers are taught methods of randomization for use at any times that too many voters are exiting the poll site to maintain 100% approach rate. The training stresses the importance of randomization and neutrality.
The ballot box remains sealed throughout the day. To document full transparency, volunteers film the sealing of the box in the early morning, the transporting of the box to a public place for counting at the end of the day after the last voters have left, the opening of the box, and an example of the public counting process. At least two people count every vote.
The researchers.
Professor Steven Freeman teaches research methods and survey/polling design at University of Pennsylvania. He co-authored the book Was The 2004 Presidential Election Stolen? Exit Polls, Election Fraud, and the Official Count, analyzing the official exit polls and vote tabulations from the 2004 election.
Sally Castleman, outgoing National Chairperson of Election Defense Alliance, has extensive experience initiating, organizing and running projects both in the private and public sectors. She took responsibility for 37 of the polling sites, in eight states, creating systems and materials, conducting trainings, and overseeing the analysis.
Marj Creech advised and assisted with the entire EVEP endeavor. She had been involved in eight prior exit polls in five states, as a pollster, planner, leader, coordinator, and observer.
Judith Alter, Professor Emeritus at UCLA, Founder and Director of Protect California Ballots, led the polling efforts at the 10 sites in Los Angeles County, CA. This was Alter’s sixth time leading an exit polling initiative; likewise, many of her 110 site leaders and poll-takers had previous exit polling experience.
Dr. Jonathan Simon has a background in polling statistics. He has performed extensive analysis
of exit poll results from the 2004 and 2006 elections.
Ken Warren has polled for the media, government, private clients, and politicians over the last two decades.
The analysis of the data was done by Richard Hayes Phillips, PhD. A former professor, Phillips has extensive experience as an investigator, data analyst, writer and expert witness. In recent years Phillips is best known for spending three years obtaining and meticulously analyzing more than 125,000 ballots, as well as poll books and voter signature books, from the 2004 election for 18 Ohio counties, culminating in his seminal book Witness to a Crime.
Volunteers.
There were a total of 312 local leaders and poll-takers for the 37 sites that Castleman led. Twelve sites were in California. This report is focused on 10 of the California sites, all in Los Angeles County. (The 2 sites in Northern California, San Francisco County and Alameda County, used a questionnaire that did not lend itself to the analysis used in this paper.) Professor Alter, the 110 volunteers cited above, and another 20 volunteers who counted questionnaire responses all participated in the L.A. effort.
Overview.
The initial results released by Edison-Mitofsky, immediately after the poll closings in California, presumably before any adjustments in the numbers were made to conform to outcomes (see section I, above), indicated a defeat of Proposition 8. The official election results from the Secretary of State's office, http://www.sos.ca.gov/elections/sov/2008_general/contents.htm [27], (and of course the final and conforming Edison-Mitofsky exit poll totals) declared Proposition 8 to have passed.
Edison-Mitofsky results for the state: 48% Yes - 52% No.
Election Day official results for the state announced the night of the election: 52.2% Yes - 47.8% No.
The final certified results for the state (29 days later): 52.3% Yes – 47.7% No.
Election Day official results for L.A. County: 50.4% Yes – 49.6% No
Random 1% tally results for L.A. County: 48% Yes - 52% No*
The final certified results for L.A. County: 50.04% Yes - 49.96% No.
Election Day official results for the 10 sites in L.A. County that were polled: 47.2% Yes - 52.79% No
The EVEP results in the 10 polled L.A. sites: 39.46% Yes - 60.54 No.
The final certified results for the 10 polled sites: 47% Yes – 53% No.
* California has a mandated random 1% hand tally, an “audit” of 1% of the precincts in each county. Fifty one precincts in L.A. County were included in the 1% manual tally; none were precincts included in the EVEP project.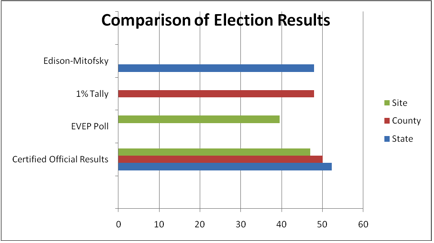
Response rates.
The percentage of voters who responded to the EVEP polling request ranged from 38% (at a site where exit poll volunteers were harassed by poll workers and forced to stand beyond the legal location for an exit poll, far from the door) to 70%. The average response rate was 56.4%.
Proposition 8 WPD.
Nine of the ten L.A. polling sites had a higher percent of “No” votes than the official numbers. The disparities ranged from -2.3% to 17.7 %, a positive percentage indicating a higher percentage of “No” votes in the EVEP than in the official results. The average WPD or discrepancy between the official results and the polling results is 7.75%. As detailed in the paper, this is considered a significant disparity.
The four possible reasons to explain the large WPDs are discussed in the paper. For the analysis, Proposition 4, which mandated parental notification and a waiting period before a minor could undergo an abortion, was used as a benchmark against which the polling results of Proposition 8 are measured. Because the two are similarly controversial social issues, it was anticipated that the populace would for the most part split on Proposition 4 (abortion) similarly to Proposition 8 (gay marriage).
The citizens’ exit polling data for Proposition 4 was within 2% of the official results; 2% is considered within the margin of error. Furthermore, the disparities between polling data and official results for Proposition 4 in some precincts favored passage of Proposition 4 and in other locations favored defeat of the proposition. This is a natural pattern which provides further indication that the polling results indeed reflect the electorate’s in-booth choices.
The differential between the official results and the polling results for Proposition 8, however, was 7.75 %, far outside the margin of error. 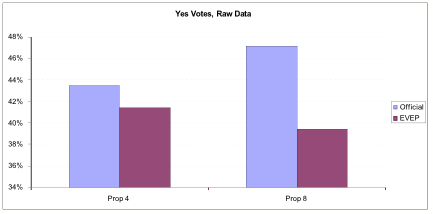
Comparison of Official Results to EVEP Results for Propositions 4 and 8
Since the need for further analysis of Proposition 8 was thus indicated, the EVEP results were then adjusted for age, gender, ethnicity/race, and party affiliation, to compensate for any demographic group(s) being over- or under-polled.
The data indicates that the WPD for Proposition 4 narrowed to 0.64%, virtually spot-on, while Proposition 8 was still well beyond the margin of error at 5.74%.
Comparison of Official Results to EVEP Results for Propositions 4 and 8, with EVEP Data
Adjusted for Party Affiliation
While this EVEP analysis strongly suggests that the official results for Proposition 8 were compromised in the tabulation process, the impact of this paper extends far beyond that particular vote and far beyond California. Voting is the bedrock protocol of any democracy, fledgling or venerable, around the globe or here at home. If the vote-counting process is not observable, that bedrock turns rapidly to quicksand.
It is too late to change the official results of Proposition 8 but it is not too late to recognize the current vulnerabilities of computerized voting throughout the United States. Our election officials who have been entrusted with the responsibility to run transparent elections are not doing so; counting votes inside black boxes renders observation of the tabulation process impossible. Even the computer log books and the like are strictly off limits to examination. The candidates and the citizens cannot know that official election results are reliable.
Electronic election equipment remains in use despite persistent evidence of computer failures, election rigging and hacking, despite the control of our elections by equipment vendors with established partisan proclivities, and despite the revelations, based on exit polling and pre-election tracking polling, that results have consistently shifted in the same direction, always to the right. Because verification by observation has been precluded by computerization, only indirect or statistical methods of verification are available.
Thus, Proposition 8 results and the EVEP analysis by Election Defense Alliance offer another opportunity among many to discover what is amiss and to make urgently needed changes. An investigation is warranted into how the fraud or gross errors happened. This knowledge is necessary for running all future elections. While it is true that reforms have been made in California and elsewhere, it appears too many serious holes remain in the system.
The evidence, in this paper and elsewhere, is strong that computerized vote-counting cannot be trusted to support our democracy. Not only is further investigation warranted but a return to a fully observable vote-counting process is imperative. Our democracy will not survive if we cannot know that our election results are accurate and honest.
The unexpected passage of Proposition 8 in California, banning same-sex marriage, has led election integrity advocates to wonder aloud if the official results were legitimate. Fortunately, two citizen groups, seeking to restore electoral integrity, Election Defense Alliance and Protect California Ballots, conducted exit polls in 12 California polling sites, 10 in Los Angeles County. The analysis of this data is presented here.
According to the official results, Proposition 8 passed overall in the state with 52.2% of the vote. In 10 L.A. county polling sites, representing 19 precincts, the official results were 47.2% Yes - 52.79% No, but the exit polls for the identical 19 precincts showed 39.46% Yes - 60.54% No. Is there a way to discern if the exit polling was flawed or the official vote count was compromised?
Proposition 4, requiring a waiting period and parental notification prior to an abortion, is clearly the most reasonable benchmark with which to compare Proposition 8, because both were “hot-button” social issues with heavily overlapping support among the electorate. Exit poll data bear this out. In the ten polling places in Los Angeles County where citizen exit polls were conducted, 66.63% voted for both propositions or against both propositions.
The official results and the exit poll results for Proposition 4 differed by only 2.06%, well within the margin of error, whereas Proposition 8, with a disparity of 7.75%, is far outside that margin. If the official votecounts were accurate and participation in the exit poll was influenced by the “politics” of those polled, we would expect a very similar effect on the results for the two Propositions, yielding very similar disparities rather than the very different disparities we found.?
Furthermore, the Proposition 8 disparity appears in nine of the 10 sites in the same direction; i.e., in 90% of the sites, the exit polling data show more votes against Proposition 8. One would expect that disparities should balance out – some in one direction, and some in the other. The very fact that this was the case in regard to Proposition 4 but not Proposition 8, together with the large difference in disparity between the two, suggests the official results for Proposition 8 are compromised.
There are four possible reasons for a large disparity between exit polls and official results:
(1) a basic flaw in the exit poll methodology;
(2) many voters lying on the questionnaires;
(3) a non-representative sample of voters responding; or
(4) the official results being erroneous or fraudulent.
As for possibilities 1 and 2, the constituencies for Propositions 4 and 8 were similar enough that it is hard to imagine a bias that would show up only in results for Proposition 8 and not in Proposition 4. The fact that the polling results accurately reflected the official count for Proposition 4 may be taken as validating both the vote count and the exit poll as conducted at the L.A. County sites.
As for possibility 3 above, the respondents actually were not a truly random sample of the voters, since some voters chose not to participate. To determine if this accounts for the large disparity, the full analysis goes further and adjusts the data for gender, race, age and party affiliation.
That is, the necessary changes are made to the polling data to assume the gender, ethnicity, age and party affiliation more accurately reflect the voting population for a given site.
Even with the data so normalized, the disparities remain too large to dismiss as random. The overall Proposition 8 disparity remains 5.74% (as opposed to 0.64% for Proposition 4 when normalized.) As seen on the bell curve below, the Proposition 8 results are still well outside the margin of error —a glaring red flag.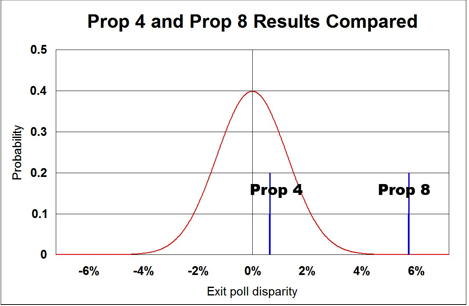
To answer possible criticism that it might not be accurate to apply the percentage of votes of the Republican poll respondents to those Republicans who voted but did not participate, the data is examined further. It shows that if our samples of Democratic, third-party, and Independent voters were representative of the electorate, then even if every non-participating Republican voter registered a Yes vote for Proposition 8, it would not have been mathematically possible to come out with the official results.
The only remaining explanation is possibility 4, the official results being erroneous or fraudulent. Further investigation is warranted, one that includes penetrating the proprietary secrecy behind which the voting equipment corporations have hidden their processes.
Furthermore, every candidate and every American should be alarmed enough to reject our current election conditions in which over 95% of our votes are counted electronically with no means of citizen oversight.
Our own cherished democracy—if it continues to count its votes in secret—is no more immune to anti-democratic manipulation than is the newest and shakiest democracy halfway around the world.
Election Defense Alliance is a program of Columbus Institute for Contemporary Journalism, a nonprofit organization under Section 501(c)(3) of the IRS Code.
Links:
[1] http://www.electiondefensealliance.org/polling/signup.php
[2] http://electiondefensealliance.org/exit_polling
[3] http://electiondefensealliance.org/independent_exit_polls
[4] http://www.electiondefensealliance.org/citizens_election_verification_poll_evp
[5] http://www.electiondefensealliance.org/files/intro&exsum.pdf
[6] http://electiondefensealliance.org/EDA-Exit-Polls-2008
[7] http://electiondefensealliance.org/files/intro&exsum.pdf
[8] http://electiondefensealliance.org/files/CA-Prop8-Exit-Polls-LA-County-RHP.pdf
[9] http://electiondefensealliance.org/Was-CA-Prop-8-Election-Rigged
[10] http://www.electiondefensealliance.org/files/intro&exsum fo.pdf
[11] http://www.electiondefensealliance.org/files/intro&exsum forweb.pdf
[12] http://honestelections.us/evep/evep-downloads/index.php
[13] http://ElectionDefenseAlliance.org/files/EVEP-Prop8-Propositions-Adjusted.pdf
[14] http://ElectionDefenseAlliance.org/files/EVEP-Prop8-Summary-Tables-Presidential.pdf
[15] http://ElectionDefenseAlliance.org/files/EVEP-Prop8-Summary-Tables-Propositions.pdf
[16] http://ElectionDefenseAlliance.org/files/Prop8-EVEP-Party-Affiliation.pdf
[17] http://electiondefensealliance.org/files/EDA-2008-EVEP-Citizen-Exit-Polls.pdf
[18] http://electiondefensealliance.org/CA-Prop-8-Corrupted
[19] http://electiondefensealliance.org/witness_crime_citizens_audit_american_election
[20] http://electiondefensealliance.org/node/1827
[21] http://electiondefensealliance.org/files/Congressionial-Adjusted-Party-Affiliation.pdf
[22] http://electiondefensealliance.org/files/Senate-Adjusted-Party-Affiliation.pdf
[23] http://electiondefensealliance.org/files/New-Hampshire-Adjusted-Age.pdf
[24] http://electiondefensealliance.org/files/New-Hampshire-Adjusted-Gender.pdf
[25] http://electiondefensealliance.org/files/Pennsylvania-Adjusted-Age-Gender.pdf
[26] http://electiondefensealliance.org/about_us
[27] http://www.sos.ca.gov/elections/sov/2008_general/contents.htm

